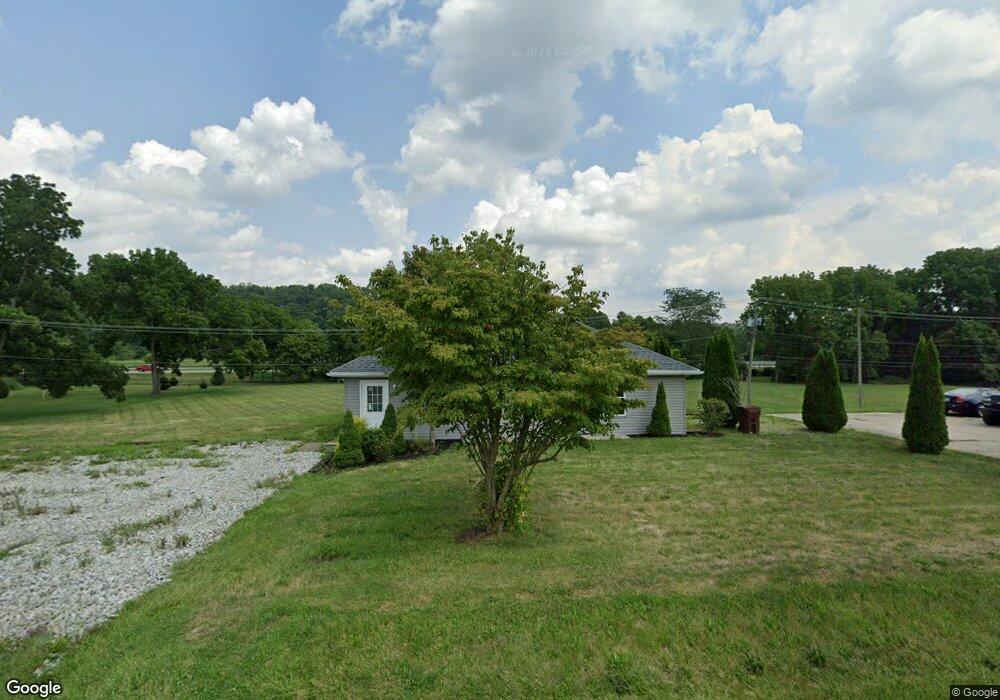
5810 Old Logan Rd SE Lancaster, OH 43130
Estimated Value: $254,000 - $301,000
2
Beds
1
Bath
1,440
Sq Ft
$192/Sq Ft
Est. Value
About This Home
This home is located at 5810 Old Logan Rd SE, Lancaster, OH 43130 and is currently estimated at $275,956, approximately $191 per square foot. 5810 Old Logan Rd SE is a home located in Fairfield County with nearby schools including Berne Union Elementary School and Berne Union High School.
Ownership History
Date
Name
Owned For
Owner Type
Purchase Details
Closed on
Aug 1, 2023
Sold by
Dareramie Llc
Bought by
Dareramie Llc
Current Estimated Value
Purchase Details
Closed on
Aug 29, 2003
Sold by
Crist Connie G
Bought by
Beatty Douglas W
Home Financials for this Owner
Home Financials are based on the most recent Mortgage that was taken out on this home.
Original Mortgage
$94,500
Interest Rate
5.97%
Mortgage Type
Unknown
Purchase Details
Closed on
Jul 24, 1996
Sold by
Wellman Ray E
Bought by
Crist Dirk L and Crist Connie G
Home Financials for this Owner
Home Financials are based on the most recent Mortgage that was taken out on this home.
Original Mortgage
$33,075
Interest Rate
8.43%
Mortgage Type
New Conventional
Purchase Details
Closed on
May 1, 1988
Purchase Details
Closed on
Jan 1, 1988
Create a Home Valuation Report for This Property
The Home Valuation Report is an in-depth analysis detailing your home's value as well as a comparison with similar homes in the area
Home Values in the Area
Average Home Value in this Area
Purchase History
| Date | Buyer | Sale Price | Title Company |
|---|---|---|---|
| Dareramie Llc | -- | None Listed On Document | |
| Beatty Douglas W | $105,000 | -- | |
| Crist Dirk L | $33,076 | -- | |
| -- | $36,000 | -- | |
| -- | $39,400 | -- |
Source: Public Records
Mortgage History
| Date | Status | Borrower | Loan Amount |
|---|---|---|---|
| Previous Owner | Beatty Douglas W | $94,500 | |
| Previous Owner | Crist Dirk L | $33,075 |
Source: Public Records
Tax History Compared to Growth
Tax History
| Year | Tax Paid | Tax Assessment Tax Assessment Total Assessment is a certain percentage of the fair market value that is determined by local assessors to be the total taxable value of land and additions on the property. | Land | Improvement |
|---|---|---|---|---|
| 2024 | $3,682 | $51,000 | $13,900 | $37,100 |
| 2023 | $1,791 | $51,000 | $13,900 | $37,100 |
| 2022 | $1,810 | $51,590 | $14,490 | $37,100 |
| 2021 | $1,535 | $39,930 | $12,600 | $27,330 |
| 2020 | $1,541 | $39,930 | $12,600 | $27,330 |
| 2019 | $1,545 | $39,930 | $12,600 | $27,330 |
| 2018 | $1,202 | $31,670 | $13,440 | $18,230 |
| 2017 | $1,125 | $31,670 | $13,440 | $18,230 |
| 2016 | $1,106 | $31,670 | $13,440 | $18,230 |
| 2015 | $1,096 | $30,850 | $13,440 | $17,410 |
| 2014 | $1,039 | $30,850 | $13,440 | $17,410 |
| 2013 | $1,039 | $30,850 | $13,440 | $17,410 |
Source: Public Records
Map
Nearby Homes
- 4155 Savage Hill Rd SE
- 7280 Sugar Grove Rd SE
- 1531 Tarkiln Rd SE
- 820 Pump Station Rd SE
- 1121 Tarkiln Rd SE Unit 109
- 284 Blue Valley Rd SE
- 509 Tarkiln Rd SE
- 513 Ross Rd SE
- 4300 Bis Rd SW
- 0 Wilson's Ln SE Unit Lot2
- 0 Wilson's Ln SE Unit Lot3
- 0 Wilson's Ln SE Unit Lot1
- 25779 Bailey Rd
- 3500 Bauman Hill Rd SE
- 25345 Buena Vista Rd
- 26067 Buena Vista Rd
- 5440 Borah Hill Rd
- 9847 Stage Rd
- 25127 Buena Vista Rd
- 1015 Taos Ln
- 5840 Old Logan Rd SE
- 5770 Old Logan Rd SE
- 5760 Old Logan Rd SE
- 5740 Old Logan Rd SE
- 5724 Old Logan Rd SE
- 5735 Old Logan Rd SE
- 5708 Old Logan Rd SE
- 5920 Old Logan Rd SE
- 5711 Old Logan Rd SE
- 5690 Old Logan Rd SE
- 5685 Old Logan Rd SE
- 5950 Old Logan Rd SE
- 5660 Old Logan Rd SE
- 2545 Berne St SE
- 5736 Fairfield St SE
- 5990 Old Logan Rd SE
- 2485 Berne St SE
- 5712 Fairfield St SE
- 5631 Old Logan Rd SE
- 5686 Fairfield St SE