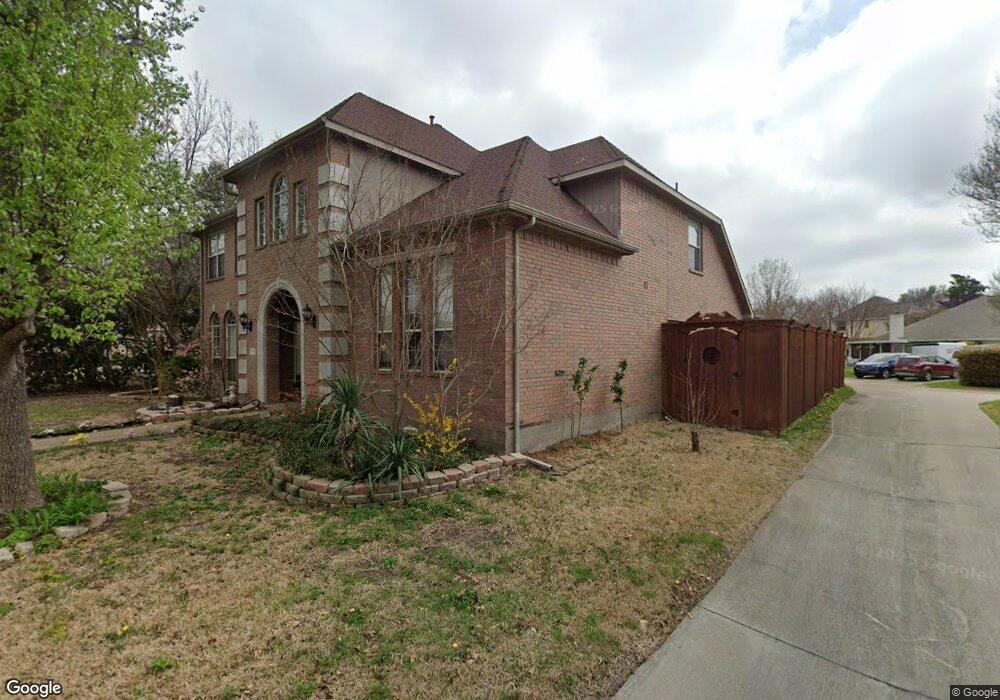
5810 Southampton Dr Richardson, TX 75082
Breckinridge NeighborhoodEstimated Value: $608,000 - $655,000
4
Beds
4
Baths
3,755
Sq Ft
$170/Sq Ft
Est. Value
About This Home
This home is located at 5810 Southampton Dr, Richardson, TX 75082 and is currently estimated at $636,558, approximately $169 per square foot. 5810 Southampton Dr is a home located in Collin County with nearby schools including Miller Elementary School, Murphy Middle School, and C A Mcmillen High School.
Ownership History
Date
Name
Owned For
Owner Type
Purchase Details
Closed on
Oct 22, 2015
Sold by
Doai Dung N and Ly Quocan J
Bought by
Ly Khanhan and Ho Tra Mi
Current Estimated Value
Home Financials for this Owner
Home Financials are based on the most recent Mortgage that was taken out on this home.
Original Mortgage
$240,000
Outstanding Balance
$189,341
Interest Rate
3.96%
Mortgage Type
New Conventional
Estimated Equity
$447,217
Purchase Details
Closed on
Jun 11, 2010
Sold by
Cooper Jerry D and Cooper Barbara Stibbens
Bought by
Doai Dung N and Ly Quocan J
Home Financials for this Owner
Home Financials are based on the most recent Mortgage that was taken out on this home.
Original Mortgage
$237,410
Interest Rate
4.87%
Mortgage Type
New Conventional
Purchase Details
Closed on
Dec 18, 2002
Sold by
Cooper Barbara Stibbens
Bought by
Cooper Jerry D
Purchase Details
Closed on
Jun 20, 1997
Sold by
Centex Homes
Bought by
Cooper Barbara Stibbens
Create a Home Valuation Report for This Property
The Home Valuation Report is an in-depth analysis detailing your home's value as well as a comparison with similar homes in the area
Home Values in the Area
Average Home Value in this Area
Purchase History
| Date | Buyer | Sale Price | Title Company |
|---|---|---|---|
| Ly Khanhan | -- | Republic Title Of Texas | |
| Doai Dung N | -- | Rtt | |
| Doai Dung N | -- | Rtt | |
| Cooper Jerry D | -- | -- | |
| Cooper Barbara Stibbens | -- | -- | |
| Cooper Barbara Stibbens | -- | -- |
Source: Public Records
Mortgage History
| Date | Status | Borrower | Loan Amount |
|---|---|---|---|
| Open | Ly Khanhan | $240,000 | |
| Previous Owner | Doai Dung N | $237,410 |
Source: Public Records
Tax History Compared to Growth
Tax History
| Year | Tax Paid | Tax Assessment Tax Assessment Total Assessment is a certain percentage of the fair market value that is determined by local assessors to be the total taxable value of land and additions on the property. | Land | Improvement |
|---|---|---|---|---|
| 2025 | $8,962 | $613,958 | $135,000 | $478,958 |
| 2024 | $8,962 | $559,138 | $112,500 | $500,388 |
| 2023 | $8,962 | $508,307 | $112,500 | $485,358 |
| 2022 | $9,493 | $462,097 | $108,000 | $427,364 |
| 2021 | $9,180 | $420,088 | $81,000 | $339,088 |
| 2020 | $8,961 | $403,866 | $72,000 | $331,866 |
| 2019 | $9,231 | $396,839 | $72,000 | $324,839 |
| 2018 | $9,051 | $387,427 | $72,000 | $315,427 |
| 2017 | $8,348 | $357,316 | $63,000 | $294,316 |
| 2016 | $8,016 | $340,564 | $54,000 | $286,564 |
| 2015 | $6,614 | $300,305 | $54,000 | $246,305 |
| 2014 | $6,614 | $287,580 | $0 | $0 |
Source: Public Records
Map
Nearby Homes
- 2720 Ranchview Dr
- 3203 Grantham Dr
- 2988 Hillingdon Dr
- 5517 Enfield Dr
- 18 Kilchurn
- 3041 Hillingdon Dr
- 3309 Grantham Dr
- 403 Pleasant Run
- 179 Moonlight Dr
- 1201 Tralee Ln
- 7022 Cottonwood Cir
- 7010 Cottonwood Cir
- 6905 Wilhelmina Dr
- 2603 Grant Dr
- 7319 Crane Dr
- 7307 Crane Dr
- 2011 Cori Place
- 2006 Cori Place
- 1001 Lochness Ln
- 1230 Donegal Ln
- 5806 Southampton Dr
- 5805 Madison Ct
- 5819 Baskerville Dr
- 102 Love Bird Ln
- 5803 Madison Ct
- 5804 Southampton Dr
- 1059 Mockingbird Hill Ct
- 5817 Baskerville Dr
- 5805 Southampton Dr
- 5801 Madison Ct
- 5806 Madison Ct
- 1063 Mockingbird Hill Ct
- 1019 Quail Hollow Ct
- 5802 Southampton Dr
- 5815 Baskerville Dr
- 106 Love Bird Ln
- 1055 Mockingbird Hill Ct
- 5803 Southampton Dr
- 2909 Madison Ct
- 1015 Quail Hollow Ct