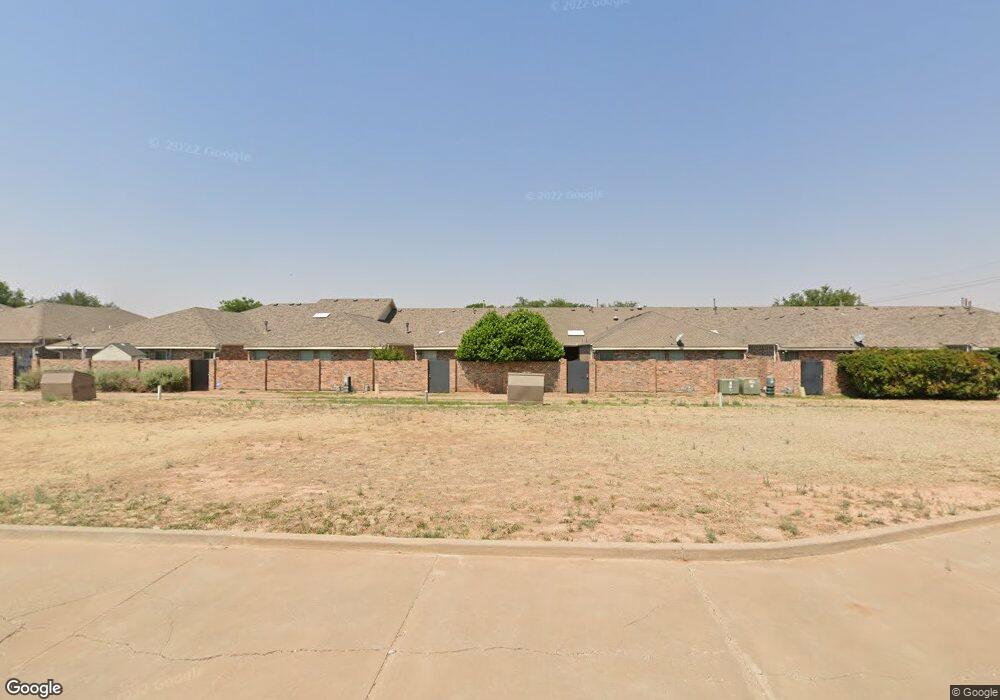
5811 11th Place Unit 3 Lubbock, TX 79416
Northridge NeighborhoodEstimated Value: $218,000 - $242,079
--
Bed
--
Bath
1,851
Sq Ft
$126/Sq Ft
Est. Value
About This Home
This home is located at 5811 11th Place Unit 3, Lubbock, TX 79416 and is currently estimated at $233,520, approximately $126 per square foot. 5811 11th Place Unit 3 is a home located in Lubbock County with nearby schools including North Ridge Elementary School, Terra Vista Middle School, and Frenship High School.
Ownership History
Date
Name
Owned For
Owner Type
Purchase Details
Closed on
Jun 14, 2013
Sold by
Layer Dana M and Layer Paul Francis
Bought by
Brown Frances Cooper
Current Estimated Value
Home Financials for this Owner
Home Financials are based on the most recent Mortgage that was taken out on this home.
Original Mortgage
$99,500
Outstanding Balance
$22,201
Interest Rate
3.38%
Mortgage Type
New Conventional
Estimated Equity
$211,319
Purchase Details
Closed on
Jun 23, 2011
Sold by
The Secretary Of Housing & Urban Develop
Bought by
Layer Dana M and Layer Paul Francis
Home Financials for this Owner
Home Financials are based on the most recent Mortgage that was taken out on this home.
Original Mortgage
$112,084
Interest Rate
4.75%
Mortgage Type
FHA
Purchase Details
Closed on
May 11, 2010
Sold by
Wells Fargo Bank Na
Bought by
The Secretary Of Housing & Urban Develop
Purchase Details
Closed on
May 4, 2010
Sold by
Mann Terri
Bought by
Wells Fargo Bank Na
Create a Home Valuation Report for This Property
The Home Valuation Report is an in-depth analysis detailing your home's value as well as a comparison with similar homes in the area
Home Values in the Area
Average Home Value in this Area
Purchase History
| Date | Buyer | Sale Price | Title Company |
|---|---|---|---|
| Brown Frances Cooper | -- | West Texas Title Company | |
| Layer Dana M | -- | None Available | |
| The Secretary Of Housing & Urban Develop | -- | None Available | |
| Wells Fargo Bank Na | $174,329 | None Available |
Source: Public Records
Mortgage History
| Date | Status | Borrower | Loan Amount |
|---|---|---|---|
| Open | Brown Frances Cooper | $99,500 | |
| Previous Owner | Layer Dana M | $112,084 |
Source: Public Records
Tax History Compared to Growth
Tax History
| Year | Tax Paid | Tax Assessment Tax Assessment Total Assessment is a certain percentage of the fair market value that is determined by local assessors to be the total taxable value of land and additions on the property. | Land | Improvement |
|---|---|---|---|---|
| 2025 | $1,451 | $213,849 | $22,400 | $191,449 |
| 2024 | $1,451 | $216,623 | $22,400 | $194,223 |
| 2023 | $4,021 | $192,028 | $22,400 | $169,628 |
| 2022 | $3,975 | $174,571 | $22,400 | $185,186 |
| 2021 | $3,838 | $158,701 | $22,400 | $136,301 |
| 2020 | $3,660 | $150,652 | $22,400 | $128,252 |
| 2019 | $4,000 | $159,993 | $22,400 | $137,593 |
| 2018 | $3,936 | $157,270 | $22,400 | $134,870 |
| 2017 | $3,980 | $158,838 | $22,400 | $136,438 |
| 2016 | $4,014 | $160,172 | $7,000 | $153,172 |
| 2015 | $3,823 | $149,190 | $7,000 | $142,190 |
| 2014 | $3,823 | $152,385 | $7,000 | $145,385 |
Source: Public Records
Map
Nearby Homes
- 5811 11th Place Unit 15
- 5811 11th Place Unit 14
- 5811 11th Place Unit 13
- 5811 11th Place Unit 12
- 5811 11th Place Unit 11
- 5811 11th Place Unit 10
- 5811 11th Place Unit 9
- 5811 11th Place Unit 8
- 5811 11th Place Unit 7
- 5811 11th Place Unit 5
- 5811 11th Place Unit 4
- 5811 11th Place Unit 2
- 5811 11th Place Unit 1
- 5811 11th Place
- 5810 12th St
- 1111 Genoa Ave
- 5808 12th St
- 1107 Genoa Ave
- 1109 Genoa Ave
- 5806 12th St