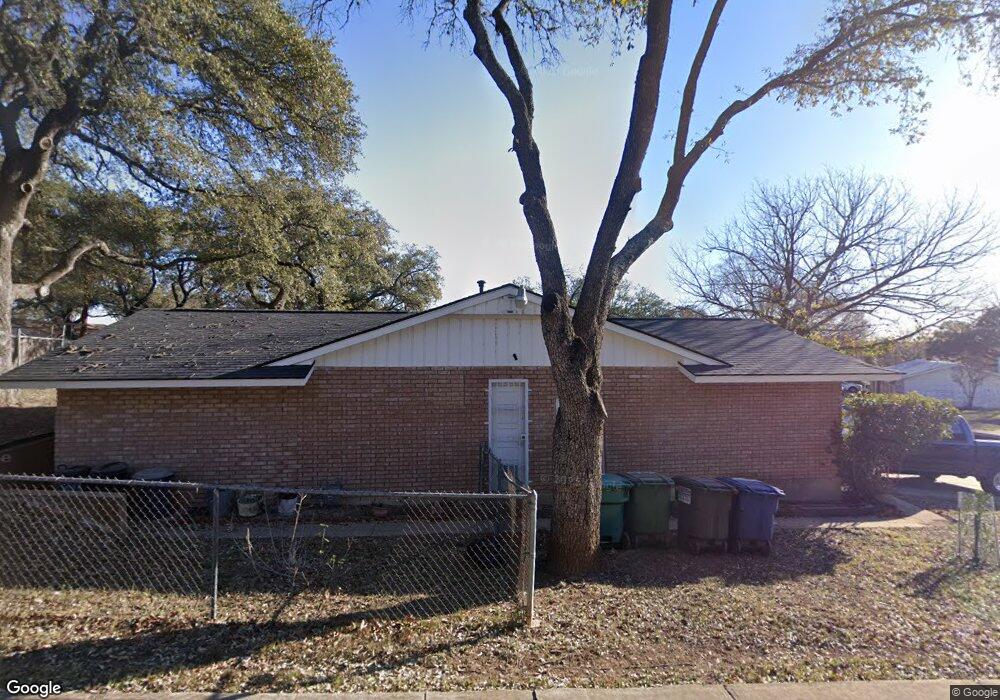
5811 Ben Casey Dr San Antonio, TX 78240
Estimated Value: $247,000 - $272,000
3
Beds
2
Baths
1,517
Sq Ft
$169/Sq Ft
Est. Value
About This Home
This home is located at 5811 Ben Casey Dr, San Antonio, TX 78240 and is currently estimated at $256,735, approximately $169 per square foot. 5811 Ben Casey Dr is a home located in Bexar County with nearby schools including Oak Hills Terrace Elementary School, Neff Middle School, and John Marshall High School.
Ownership History
Date
Name
Owned For
Owner Type
Purchase Details
Closed on
Jul 22, 2024
Sold by
De La Garza John A & Dyna M
Bought by
Dela Garza John A and De La Garza Dyna M
Current Estimated Value
Purchase Details
Closed on
Sep 30, 2020
Sold by
Kirkland Jefry K
Bought by
Rubio David and Yourdon Jessica
Home Financials for this Owner
Home Financials are based on the most recent Mortgage that was taken out on this home.
Original Mortgage
$188,397
Interest Rate
2.9%
Mortgage Type
New Conventional
Purchase Details
Closed on
Dec 19, 1997
Sold by
Beard Patricia V and Kunakoff Patricia V
Bought by
Delagarza John A and Delagarza Dyna M
Home Financials for this Owner
Home Financials are based on the most recent Mortgage that was taken out on this home.
Original Mortgage
$77,914
Interest Rate
7.22%
Mortgage Type
FHA
Create a Home Valuation Report for This Property
The Home Valuation Report is an in-depth analysis detailing your home's value as well as a comparison with similar homes in the area
Home Values in the Area
Average Home Value in this Area
Purchase History
| Date | Buyer | Sale Price | Title Company |
|---|---|---|---|
| Dela Garza John A | -- | None Listed On Document | |
| Rubio David | -- | Independence Title Company | |
| Delagarza John A | -- | -- |
Source: Public Records
Mortgage History
| Date | Status | Borrower | Loan Amount |
|---|---|---|---|
| Previous Owner | Rubio David | $188,397 | |
| Previous Owner | Delagarza John A | $77,914 |
Source: Public Records
Tax History Compared to Growth
Tax History
| Year | Tax Paid | Tax Assessment Tax Assessment Total Assessment is a certain percentage of the fair market value that is determined by local assessors to be the total taxable value of land and additions on the property. | Land | Improvement |
|---|---|---|---|---|
| 2025 | $1,973 | $244,040 | $78,110 | $165,930 |
| 2024 | $1,973 | $234,974 | $78,110 | $179,160 |
| 2023 | $1,973 | $213,613 | $78,110 | $181,570 |
| 2022 | $4,807 | $194,194 | $59,210 | $165,690 |
| 2021 | $4,526 | $176,540 | $49,610 | $126,930 |
| 2020 | $4,400 | $168,650 | $38,170 | $130,480 |
| 2019 | $4,285 | $159,940 | $24,770 | $135,170 |
| 2018 | $4,143 | $154,550 | $24,770 | $129,780 |
| 2017 | $3,840 | $143,000 | $24,770 | $127,090 |
| 2016 | $3,491 | $130,000 | $24,770 | $105,230 |
| 2015 | $2,853 | $124,784 | $24,770 | $102,960 |
| 2014 | $2,853 | $113,440 | $0 | $0 |
Source: Public Records
Map
Nearby Homes
- 6806 Farrow Place
- 6906 Forest Grove
- 6907 Forest Grove
- 5819 Gabor Dr
- 6122 Forest Ct
- 5606 Ponderosa Dr
- 5822 Gabor Dr
- 6012 Evers Rd
- 6427 Wurzbach Rd Unit 54
- 5914 Forest Mill St
- 5522 Newcome Dr
- 5723 Cary Grant Dr
- 6617 Countess Adria St
- 6041 Trone Trail
- 6520 Adair Dr
- 6002 Forest Ledge St
- 5607 Edie Adams Dr
- 5634 Charlie Chan Dr
- 5822 Dan Duryea St
- 6227 Cairo Dr
- 5807 Ben Casey Dr
- 6702 Farrow St
- 6706 Farrow Place
- 5814 Gillis Dr
- 6706 Farrow St
- 5806 Ben Casey Dr
- 5810 Gillis Dr
- 5803 Ben Casey Dr
- 5818 Gillis Dr
- 5802 Ben Casey Dr
- 6710 Farrow St
- 5822 Gillis Dr
- 5735 Ben Casey Dr
- 5803 Gillis Dr
- 5907 Forest Cove
- 5730 Ben Casey Dr
- 6615 Presley Dr
- 5911 Forest Cove
- 6714 Farrow Place
- 6714 Farrow St