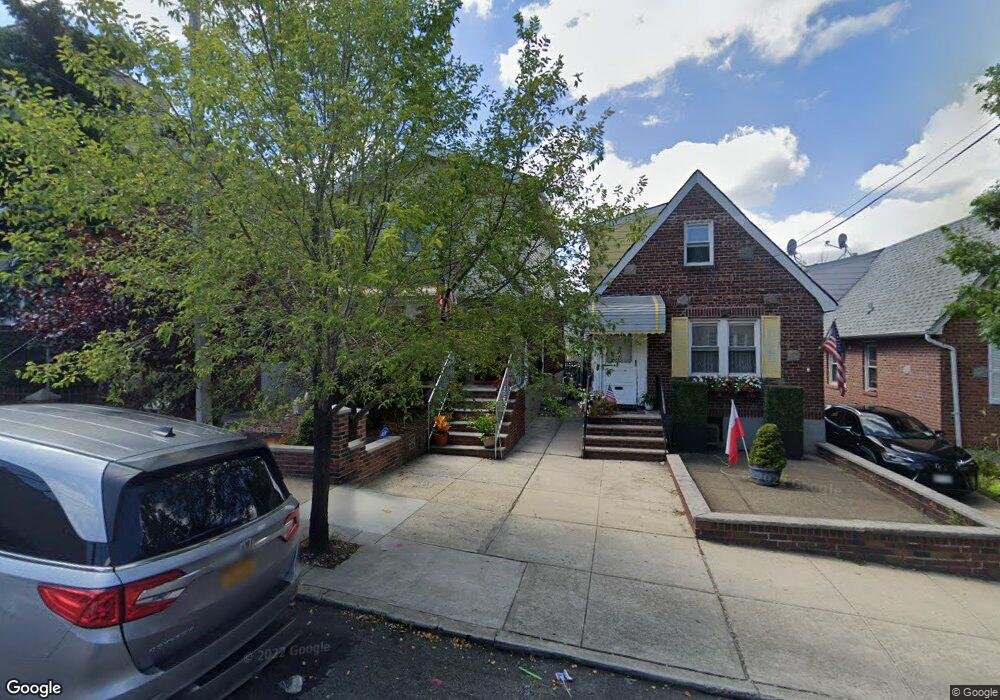
5812 64th St Maspeth, NY 11378
Maspeth NeighborhoodEstimated Value: $935,000 - $1,035,000
Studio
--
Bath
1,509
Sq Ft
$642/Sq Ft
Est. Value
About This Home
This home is located at 5812 64th St, Maspeth, NY 11378 and is currently estimated at $968,220, approximately $641 per square foot. 5812 64th St is a home located in Queens County with nearby schools including P.S. 153 Maspeth, IS 73 - The Frank Sansivieri School, and Grover Cleveland High School.
Ownership History
Date
Name
Owned For
Owner Type
Purchase Details
Closed on
Apr 22, 2022
Sold by
Logrono Miguel and Logrono Nidia
Bought by
Ahmed Mehedi and Islam Mohammad Nurul
Current Estimated Value
Home Financials for this Owner
Home Financials are based on the most recent Mortgage that was taken out on this home.
Original Mortgage
$744,000
Outstanding Balance
$704,852
Interest Rate
5.11%
Mortgage Type
Purchase Money Mortgage
Estimated Equity
$263,368
Purchase Details
Closed on
Sep 4, 1997
Sold by
Keany Brendan
Bought by
Logrono Nidia and Logrono Miguel
Create a Home Valuation Report for This Property
The Home Valuation Report is an in-depth analysis detailing your home's value as well as a comparison with similar homes in the area
Home Values in the Area
Average Home Value in this Area
Purchase History
| Date | Buyer | Sale Price | Title Company |
|---|---|---|---|
| Ahmed Mehedi | $930,000 | -- | |
| Logrono Nidia | $178,500 | First American Title Ins Co |
Source: Public Records
Mortgage History
| Date | Status | Borrower | Loan Amount |
|---|---|---|---|
| Open | Ahmed Mehedi | $744,000 |
Source: Public Records
Tax History
| Year | Tax Paid | Tax Assessment Tax Assessment Total Assessment is a certain percentage of the fair market value that is determined by local assessors to be the total taxable value of land and additions on the property. | Land | Improvement |
|---|---|---|---|---|
| 2025 | $8,173 | $43,135 | $6,626 | $36,509 |
| 2024 | $8,173 | $40,694 | $6,940 | $33,754 |
| 2023 | $7,757 | $38,621 | $5,995 | $32,626 |
| 2022 | $7,423 | $59,700 | $8,820 | $50,880 |
| 2021 | $7,723 | $54,360 | $8,820 | $45,540 |
| 2020 | $7,313 | $46,740 | $8,820 | $37,920 |
| 2019 | $6,801 | $45,840 | $8,820 | $37,020 |
| 2018 | $6,263 | $32,184 | $6,209 | $25,975 |
| 2017 | $6,261 | $32,184 | $7,179 | $25,005 |
| 2016 | $6,038 | $32,184 | $7,179 | $25,005 |
| 2015 | $3,770 | $29,955 | $9,230 | $20,725 |
| 2014 | $3,770 | $28,260 | $9,780 | $18,480 |
Source: Public Records
Map
Nearby Homes
- 57-22 63rd St
- 6439 58th Rd
- 6451 59th Ave
- 6448 58th Rd
- 5911 Fresh Pond Rd
- 61-38 Grand Ave
- 6060 Flushing Ave
- 61-22 56th Dr
- 5974 Fresh Pond Rd
- 59-81 Grand Ave
- 56-57 61st St
- 57-16 66th St
- 64-42 60th Rd
- 58-22 60th Place
- 6511 Perry Ave
- 61-54 56th Ave
- 60-15 Maspeth Ave
- 62-63 60th Dr
- 5912 58th Rd
- 5801 59th St
Your Personal Tour Guide
Ask me questions while you tour the home.