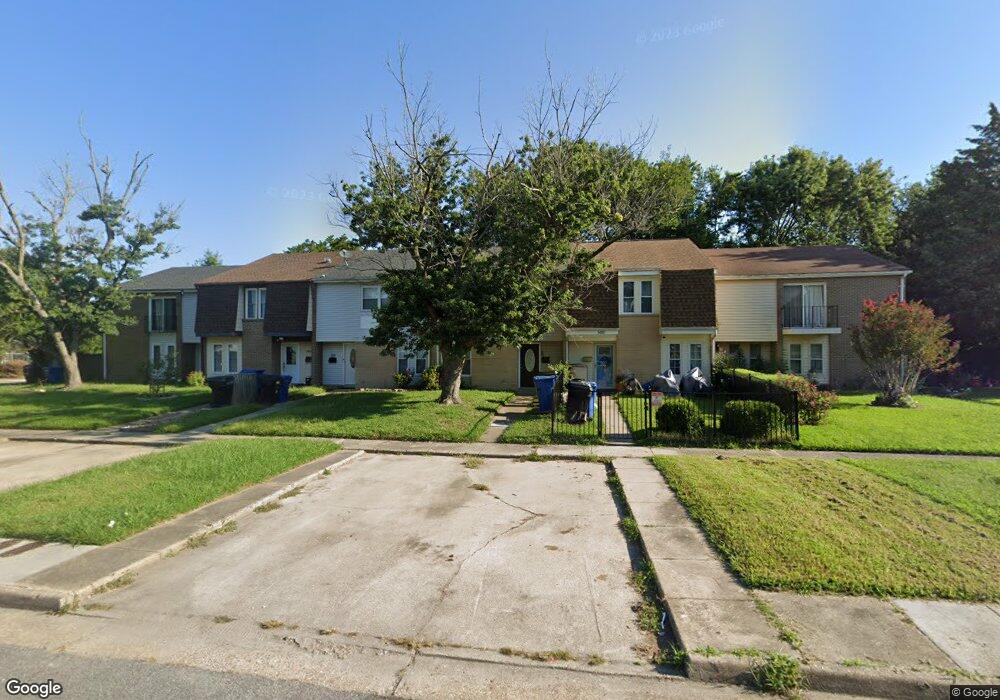
5812 S Cherokee Cluster Virginia Beach, VA 23462
Estimated Value: $186,000 - $257,604
3
Beds
3
Baths
1,594
Sq Ft
$132/Sq Ft
Est. Value
About This Home
This home is located at 5812 S Cherokee Cluster, Virginia Beach, VA 23462 and is currently estimated at $210,901, approximately $132 per square foot. 5812 S Cherokee Cluster is a home located in Virginia Beach City with nearby schools including Arrowhead Elementary School, Larkspur Middle School, and Kempsville High School.
Ownership History
Date
Name
Owned For
Owner Type
Purchase Details
Closed on
Dec 9, 2019
Sold by
Jason Feuerhahn Llc
Bought by
Bell Howard Lee and Bell Rita D
Current Estimated Value
Home Financials for this Owner
Home Financials are based on the most recent Mortgage that was taken out on this home.
Original Mortgage
$175,000
Outstanding Balance
$154,589
Interest Rate
3.7%
Mortgage Type
VA
Estimated Equity
$56,312
Purchase Details
Closed on
Jun 26, 2019
Sold by
Britt Camille L
Bought by
Jason Feuerhahn Llc
Purchase Details
Closed on
Nov 19, 2003
Sold by
Winn Douglas
Bought by
Britt Camille
Home Financials for this Owner
Home Financials are based on the most recent Mortgage that was taken out on this home.
Original Mortgage
$80,364
Interest Rate
5.96%
Mortgage Type
FHA
Create a Home Valuation Report for This Property
The Home Valuation Report is an in-depth analysis detailing your home's value as well as a comparison with similar homes in the area
Home Values in the Area
Average Home Value in this Area
Purchase History
| Date | Buyer | Sale Price | Title Company |
|---|---|---|---|
| Bell Howard Lee | $175,000 | Vintage Estates & Title | |
| Jason Feuerhahn Llc | $100,000 | Linear Title & Escrow Llc | |
| Britt Camille | $81,000 | -- |
Source: Public Records
Mortgage History
| Date | Status | Borrower | Loan Amount |
|---|---|---|---|
| Open | Bell Howard Lee | $175,000 | |
| Previous Owner | Britt Camille | $80,364 |
Source: Public Records
Tax History Compared to Growth
Tax History
| Year | Tax Paid | Tax Assessment Tax Assessment Total Assessment is a certain percentage of the fair market value that is determined by local assessors to be the total taxable value of land and additions on the property. | Land | Improvement |
|---|---|---|---|---|
| 2025 | $1,992 | $228,600 | $72,000 | $156,600 |
| 2024 | $1,992 | $205,400 | $67,000 | $138,400 |
| 2023 | $1,853 | $187,200 | $57,000 | $130,200 |
| 2022 | $1,798 | $181,600 | $53,000 | $128,600 |
| 2021 | $1,693 | $171,000 | $52,000 | $119,000 |
| 2020 | $1,644 | $161,600 | $52,000 | $109,600 |
| 2019 | $1,431 | $135,100 | $48,400 | $86,700 |
| 2018 | $1,354 | $135,100 | $48,400 | $86,700 |
| 2017 | $1,311 | $130,800 | $47,000 | $83,800 |
| 2016 | $1,276 | $128,900 | $47,000 | $81,900 |
| 2015 | $1,249 | $126,200 | $47,000 | $79,200 |
| 2014 | $1,161 | $128,100 | $44,800 | $83,300 |
Source: Public Records
Map
Nearby Homes
- 5729 Pontiac Rd
- 5820 N Ottawa Rd
- 229 S Newtown Rd
- 6069 Edison Ave
- 324 E Chickasaw Rd
- 341 E Chickasaw Rd
- 336 S Newtown Rd
- 330 Peace Haven Dr
- 120 Kidd Blvd
- 6018 Rolleston Ave
- 112 Honaker Ave
- 301 Faulk Rd
- 154 Frizzell Ave
- 5708 Normandy Ave
- 5801 Lathan Rd
- 5926 Mcginnis Cir
- 6549 Stoney Point S
- 540 Sterling Rd
- 300 Pefley Dr
- 5375 Palmyra Ct
- 5812 S Cherokee Cluster
- 5810 S Cherokee Cluster
- 5814 S Cherokee Cluster
- 5814 S Cherokee Cluster
- 5810 S Cherokee Cluster
- 5816 S Cherokee Cluster
- 5808 S Cherokee Cluster
- 5818 S Cherokee Cluster
- 5818 S Cherokee Cluster
- 5815 N Cherokee Cluster
- 5811 N Cherokee Cluster
- 5815 N Cherokee Cluster
- 5809 N Cherokee Cluster
- 5813 N Cherokee Cluster
- 5809 N Cherokee Cluster
- 5817 N Cherokee Cluster
- 5819 N Cherokee Cluster
- 5806 S Cherokee Cluster
- 5821 N Cherokee Cluster
- 5806 Cherokee Cluster