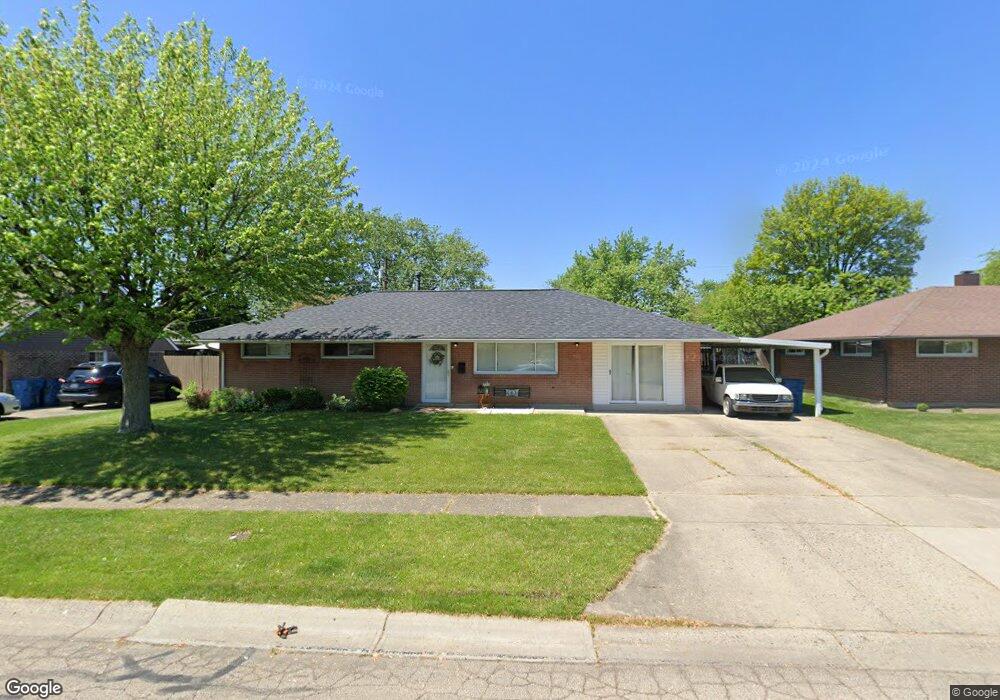
5813 Resik Dr Dayton, OH 45424
Estimated Value: $189,737 - $209,000
3
Beds
2
Baths
1,404
Sq Ft
$140/Sq Ft
Est. Value
About This Home
This home is located at 5813 Resik Dr, Dayton, OH 45424 and is currently estimated at $196,184, approximately $139 per square foot. 5813 Resik Dr is a home located in Montgomery County with nearby schools including Wayne High School and Huber Heights Christian Academy.
Ownership History
Date
Name
Owned For
Owner Type
Purchase Details
Closed on
May 3, 2023
Sold by
Gillenwater Lori A and Gillenwater David A
Bought by
Gillenwater Conner
Current Estimated Value
Home Financials for this Owner
Home Financials are based on the most recent Mortgage that was taken out on this home.
Original Mortgage
$132,050
Outstanding Balance
$128,378
Interest Rate
6.39%
Mortgage Type
New Conventional
Estimated Equity
$67,806
Purchase Details
Closed on
Nov 1, 2006
Sold by
Richards Cheri L and Richards John W
Bought by
Gillenwater David A and Gillenwater Lori A
Home Financials for this Owner
Home Financials are based on the most recent Mortgage that was taken out on this home.
Original Mortgage
$76,125
Interest Rate
6.36%
Mortgage Type
FHA
Purchase Details
Closed on
Oct 1, 1997
Sold by
Gillenwater Barbara Jean
Bought by
Richards Cheri L
Create a Home Valuation Report for This Property
The Home Valuation Report is an in-depth analysis detailing your home's value as well as a comparison with similar homes in the area
Home Values in the Area
Average Home Value in this Area
Purchase History
| Date | Buyer | Sale Price | Title Company |
|---|---|---|---|
| Gillenwater Conner | $139,000 | None Listed On Document | |
| Gillenwater David A | $90,000 | Attorney | |
| Richards Cheri L | -- | -- | |
| Gillenwater Barbara Jean | -- | -- |
Source: Public Records
Mortgage History
| Date | Status | Borrower | Loan Amount |
|---|---|---|---|
| Open | Gillenwater Conner | $132,050 | |
| Previous Owner | Gillenwater David A | $76,125 |
Source: Public Records
Tax History Compared to Growth
Tax History
| Year | Tax Paid | Tax Assessment Tax Assessment Total Assessment is a certain percentage of the fair market value that is determined by local assessors to be the total taxable value of land and additions on the property. | Land | Improvement |
|---|---|---|---|---|
| 2024 | $2,465 | $47,770 | $10,010 | $37,760 |
| 2023 | $2,465 | $47,770 | $10,010 | $37,760 |
| 2022 | $2,185 | $33,380 | $7,000 | $26,380 |
| 2021 | $2,217 | $33,380 | $7,000 | $26,380 |
| 2020 | $2,219 | $33,380 | $7,000 | $26,380 |
| 2019 | $2,051 | $27,250 | $7,000 | $20,250 |
| 2018 | $2,058 | $27,250 | $7,000 | $20,250 |
| 2017 | $2,044 | $27,250 | $7,000 | $20,250 |
| 2016 | $1,940 | $25,180 | $7,000 | $18,180 |
| 2015 | $2,100 | $25,180 | $7,000 | $18,180 |
| 2014 | $2,100 | $25,180 | $7,000 | $18,180 |
| 2012 | -- | $27,420 | $8,750 | $18,670 |
Source: Public Records
Map
Nearby Homes
- 6100 Farmborough Dr
- 5455 Flotron Dr
- 5488 Flotron Dr
- 5630 Botkins Rd
- 5912 Bavaria Place
- 6109 Ansbury Dr
- 5159 Fishburg Rd
- 4918 Powell Rd
- 5983 Harshmanville Rd
- 4848 Rittenhouse Dr
- 5952 Tibet Dr
- 5004 Fishburg Rd
- 4825 Nelapark Dr
- 5455 Naughton Dr
- 5625 Copley Cir
- 5431 Naughton Dr
- 5669 Traymore Dr
- 5848 Tomberg St
- 5732 Benedict Rd
- 5893 Tomberg St