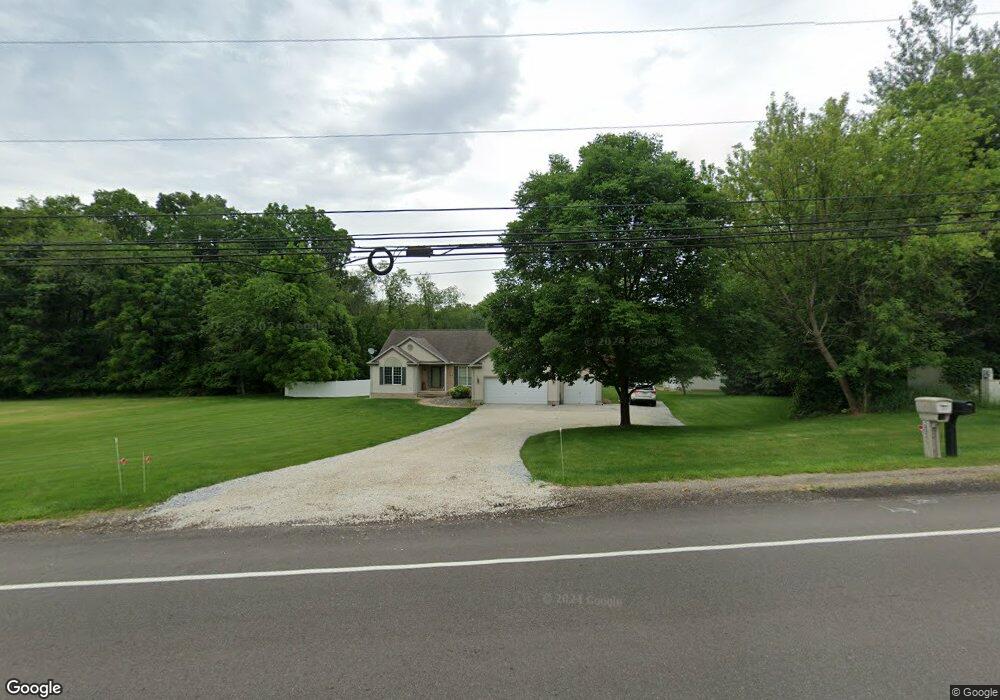
5813 S Cleveland Massillon Rd New Franklin, OH 44216
Estimated Value: $365,000 - $502,672
3
Beds
2
Baths
1,862
Sq Ft
$232/Sq Ft
Est. Value
About This Home
This home is located at 5813 S Cleveland Massillon Rd, New Franklin, OH 44216 and is currently estimated at $432,168, approximately $232 per square foot. 5813 S Cleveland Massillon Rd is a home located in Summit County with nearby schools including Norton Primary Elementary School, Norton Middle School, and Norton High School.
Ownership History
Date
Name
Owned For
Owner Type
Purchase Details
Closed on
May 23, 2019
Sold by
Conrad Ralph E and Conrad Francene A
Bought by
Scofield Steven D
Current Estimated Value
Home Financials for this Owner
Home Financials are based on the most recent Mortgage that was taken out on this home.
Original Mortgage
$226,000
Outstanding Balance
$197,882
Interest Rate
4.1%
Mortgage Type
New Conventional
Estimated Equity
$234,286
Purchase Details
Closed on
Jun 29, 2001
Sold by
Conrad Ralph E and Conrad Francene A
Bought by
Conrad Ralph E and Conrad Francene A
Create a Home Valuation Report for This Property
The Home Valuation Report is an in-depth analysis detailing your home's value as well as a comparison with similar homes in the area
Home Values in the Area
Average Home Value in this Area
Purchase History
| Date | Buyer | Sale Price | Title Company |
|---|---|---|---|
| Scofield Steven D | $340,000 | America Land Title Llc | |
| Conrad Ralph E | -- | -- |
Source: Public Records
Mortgage History
| Date | Status | Borrower | Loan Amount |
|---|---|---|---|
| Open | Scofield Steven D | $226,000 |
Source: Public Records
Tax History Compared to Growth
Tax History
| Year | Tax Paid | Tax Assessment Tax Assessment Total Assessment is a certain percentage of the fair market value that is determined by local assessors to be the total taxable value of land and additions on the property. | Land | Improvement |
|---|---|---|---|---|
| 2025 | $5,509 | $132,308 | $23,629 | $108,679 |
| 2024 | $5,226 | $132,308 | $23,629 | $108,679 |
| 2023 | $10,369 | $132,308 | $23,629 | $108,679 |
| 2022 | $5,143 | $105,918 | $18,463 | $87,455 |
| 2021 | $5,163 | $105,918 | $18,463 | $87,455 |
| 2020 | $4,836 | $97,300 | $18,460 | $78,840 |
| 2019 | $3,630 | $77,030 | $16,130 | $60,900 |
| 2018 | $3,570 | $77,030 | $16,130 | $60,900 |
| 2017 | $3,527 | $77,030 | $16,130 | $60,900 |
| 2016 | $3,480 | $69,300 | $16,130 | $53,170 |
| 2015 | $3,527 | $69,300 | $16,130 | $53,170 |
| 2014 | $3,494 | $69,300 | $16,130 | $53,170 |
| 2013 | $3,539 | $70,750 | $16,130 | $54,620 |
Source: Public Records
Map
Nearby Homes
- 0 Grill Rd
- V/L Monroe Square
- 5239 Monroe Square E
- V/L Bishop Oval
- 3241 Grill Rd
- 2536 Emmons Dr
- 000 Haynes Ave
- 1480 Maple St
- 1413 Ries St
- 1216 Stratford St
- 1232 Stratford St
- 1081 Stratford St
- 1125 Prospect St
- 1099 Prospect St
- 14740 Oak Grove Dr Unit 41
- 1144 Benton St
- 1212 Benton St
- 1240 Benton St
- 96 Waltz Dr
- 132 31st St SW
- 5813 S Cleveland Massillon Rd
- 5845 S Cleveland Massillon Rd
- 5845 S Cleveland Massillon Rd
- 5794 S Cleveland Massillon Rd
- 5763 S Cleveland Massillon Rd
- 5780 Cleveland Massillon Rd
- 3119 Vanderhoof Rd
- 3091 Vanderhoof Rd
- 3169 Vanderhoof Rd
- 3179 Vanderhoof Rd
- 5754 S Cleveland Massillon Rd
- 3191 Vanderhoof Rd
- 3114 Vanderhoof Rd
- 3168 Vanderhoof Rd
- 5637 S Cleveland Massillon Rd
- 3217 Vanderhoof Rd
- 3201 Vanderhoof Rd
- 581 31st St SW Unit 118
- 581 31st St SW Unit 118
- 581 31st St SW Unit 118