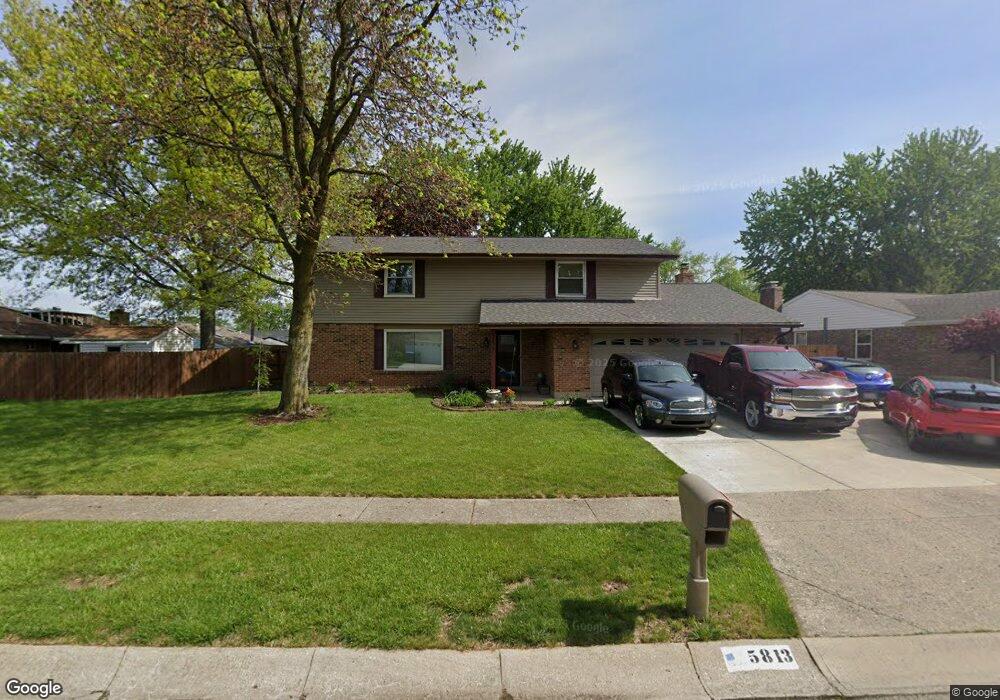
5813 Stonegate Ct Dayton, OH 45424
Estimated Value: $288,000 - $328,000
4
Beds
3
Baths
2,202
Sq Ft
$140/Sq Ft
Est. Value
About This Home
This home is located at 5813 Stonegate Ct, Dayton, OH 45424 and is currently estimated at $307,475, approximately $139 per square foot. 5813 Stonegate Ct is a home located in Montgomery County with nearby schools including Wayne High School and Huber Heights Christian Academy.
Ownership History
Date
Name
Owned For
Owner Type
Purchase Details
Closed on
Nov 24, 2021
Sold by
Ferguson Kenneth and Ferguson Jacqueline
Bought by
White Eric Lee and White Susan E
Current Estimated Value
Home Financials for this Owner
Home Financials are based on the most recent Mortgage that was taken out on this home.
Original Mortgage
$217,175
Outstanding Balance
$199,744
Interest Rate
3.11%
Mortgage Type
New Conventional
Estimated Equity
$107,731
Purchase Details
Closed on
Aug 9, 2002
Sold by
Mcarthur Timothy S
Bought by
Ferguson Kenneth and Ferguson Jacqueline
Home Financials for this Owner
Home Financials are based on the most recent Mortgage that was taken out on this home.
Original Mortgage
$141,775
Interest Rate
6.64%
Mortgage Type
FHA
Purchase Details
Closed on
Jul 26, 1999
Sold by
Butler Marion K and Butler Carol S
Bought by
Mcarthur Timothy S
Home Financials for this Owner
Home Financials are based on the most recent Mortgage that was taken out on this home.
Original Mortgage
$113,000
Interest Rate
7.69%
Create a Home Valuation Report for This Property
The Home Valuation Report is an in-depth analysis detailing your home's value as well as a comparison with similar homes in the area
Home Values in the Area
Average Home Value in this Area
Purchase History
| Date | Buyer | Sale Price | Title Company |
|---|---|---|---|
| White Eric Lee | $255,500 | Pctitle Pros | |
| Ferguson Kenneth | $144,000 | Express Title Services Of Oh | |
| Mcarthur Timothy S | $123,000 | -- |
Source: Public Records
Mortgage History
| Date | Status | Borrower | Loan Amount |
|---|---|---|---|
| Open | White Eric Lee | $217,175 | |
| Previous Owner | Ferguson Kenneth | $141,775 | |
| Previous Owner | Mcarthur Timothy S | $113,000 |
Source: Public Records
Tax History Compared to Growth
Tax History
| Year | Tax Paid | Tax Assessment Tax Assessment Total Assessment is a certain percentage of the fair market value that is determined by local assessors to be the total taxable value of land and additions on the property. | Land | Improvement |
|---|---|---|---|---|
| 2024 | $3,768 | $73,270 | $14,910 | $58,360 |
| 2023 | $3,768 | $73,270 | $14,910 | $58,360 |
| 2022 | $3,364 | $51,580 | $10,500 | $41,080 |
| 2021 | $3,412 | $51,580 | $10,500 | $41,080 |
| 2020 | $3,415 | $51,580 | $10,500 | $41,080 |
| 2019 | $3,464 | $46,290 | $10,500 | $35,790 |
| 2018 | $3,475 | $46,290 | $10,500 | $35,790 |
| 2017 | $3,452 | $46,290 | $10,500 | $35,790 |
| 2016 | $3,430 | $44,810 | $10,500 | $34,310 |
| 2015 | $3,386 | $44,810 | $10,500 | $34,310 |
| 2014 | $3,386 | $44,810 | $10,500 | $34,310 |
| 2012 | -- | $46,880 | $10,500 | $36,380 |
Source: Public Records
Map
Nearby Homes
- 5901 Timbergate Trail
- 8948 Autumngate Ln
- 5660 Shull Rd
- 8436 Indian Mound Dr
- 8671 Pinegate Way
- 6117 Charlesgate Rd
- 4957 Country Park Dr
- 8554 Schoolgate Dr
- 8041 Bushclover Dr
- 6089 Green Knolls Dr
- 4704 Cobblestone Dr Unit 4704
- 4676 Cobblestone Dr Unit 4676
- 8133 Bushclover Dr
- 6219 Beacon Tree Ct
- 8830 Christygate Ln
- 4620 Cobblestone Dr Unit 4620
- 3109 Coneflower Dr
- 6334 Shull Rd
- 2003 Trillium Way
- 8930 Century Ln
- 5823 Stonegate Ct
- 8880 Swinging Gate Dr
- 8890 Swinging Gate Dr
- 5833 Stonegate Ct
- 8908 Autumngate Ln
- 5812 Stonegate Ct
- 5822 Stonegate Ct
- 8860 Swinging Gate Dr
- 8900 Swinging Gate Dr
- 8910 Autumngate Ln
- 5832 Stonegate Ct
- 5843 Stonegate Ct
- 5842 Stonegate Ct
- 8881 Swinging Gate Dr
- 8850 Swinging Gate Dr
- 8891 Swinging Gate Dr
- 8871 Swinging Gate Dr
- 8912 Autumngate Ln
- 5817 Charlesgate Rd
- 5807 Charlesgate Rd