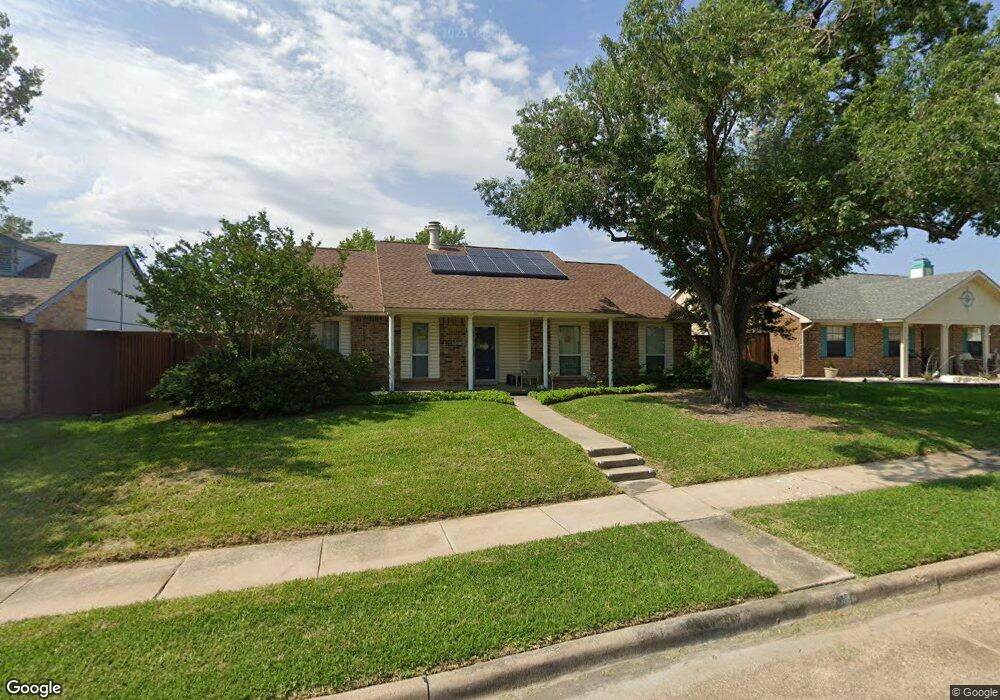
5813 Trego Cir the Colony, TX 75056
Estimated Value: $352,125 - $376,000
3
Beds
1
Bath
1,748
Sq Ft
$206/Sq Ft
Est. Value
About This Home
This home is located at 5813 Trego Cir, the Colony, TX 75056 and is currently estimated at $360,781, approximately $206 per square foot. 5813 Trego Cir is a home located in Denton County with nearby schools including B B Owen Elementary School, Griffin Middle School, and The Colony High School.
Ownership History
Date
Name
Owned For
Owner Type
Purchase Details
Closed on
May 3, 2006
Sold by
Story Christopher Hood
Bought by
Story Tammy Sue
Current Estimated Value
Purchase Details
Closed on
Jul 11, 1995
Sold by
Potter William H and Potter Kim R
Bought by
Story Christopher H and Story Tammy Sue
Home Financials for this Owner
Home Financials are based on the most recent Mortgage that was taken out on this home.
Original Mortgage
$78,425
Interest Rate
7.65%
Mortgage Type
FHA
Purchase Details
Closed on
May 20, 1994
Sold by
Roy James Kenneth and Roy Wilda Dean
Bought by
Potter William H and Potter Kim R
Home Financials for this Owner
Home Financials are based on the most recent Mortgage that was taken out on this home.
Original Mortgage
$65,440
Interest Rate
8.19%
Mortgage Type
FHA
Create a Home Valuation Report for This Property
The Home Valuation Report is an in-depth analysis detailing your home's value as well as a comparison with similar homes in the area
Home Values in the Area
Average Home Value in this Area
Purchase History
| Date | Buyer | Sale Price | Title Company |
|---|---|---|---|
| Story Tammy Sue | -- | None Available | |
| Story Christopher H | -- | -- | |
| Potter William H | -- | -- |
Source: Public Records
Mortgage History
| Date | Status | Borrower | Loan Amount |
|---|---|---|---|
| Closed | Story Christopher H | $78,425 | |
| Previous Owner | Potter William H | $65,440 |
Source: Public Records
Tax History Compared to Growth
Tax History
| Year | Tax Paid | Tax Assessment Tax Assessment Total Assessment is a certain percentage of the fair market value that is determined by local assessors to be the total taxable value of land and additions on the property. | Land | Improvement |
|---|---|---|---|---|
| 2025 | $5,003 | $312,000 | $64,350 | $247,650 |
| 2024 | $6,199 | $319,440 | $0 | $0 |
| 2023 | $4,519 | $290,400 | $60,775 | $298,225 |
| 2022 | $5,542 | $264,000 | $60,775 | $275,972 |
| 2021 | $5,345 | $240,000 | $42,900 | $197,100 |
| 2020 | $5,135 | $231,000 | $42,900 | $188,100 |
| 2019 | $4,934 | $214,930 | $42,900 | $204,732 |
| 2018 | $4,514 | $195,391 | $42,900 | $175,400 |
| 2017 | $4,149 | $177,628 | $30,261 | $147,367 |
| 2016 | $3,752 | $162,403 | $30,261 | $134,932 |
| 2015 | $3,054 | $147,639 | $20,057 | $127,582 |
| 2013 | -- | $120,951 | $20,057 | $100,894 |
Source: Public Records
Map
Nearby Homes
- 5633 Trego St
- 5621 Truitt St
- 3399 Columbus Dr
- 3581 Senate Ln
- 3487 Pilgrim Dr
- 5588 Squires Dr
- 5912 Madison Dr
- 6076 Dooley Dr
- 6082 Dooley Dr
- 3459 United Ln
- 5687 Southern Hills Dr
- 5613 Woodlands Dr
- 5617 Woodlands Dr
- 5621 Woodlands Dr
- 5661 Woodlands Dr
- 3908 Banner Dr
- 4592 Biltmoore Dr
- 4613 Shadow Ridge Dr
- 3325 Nutmeg Cir
- 5549 Ragan Dr