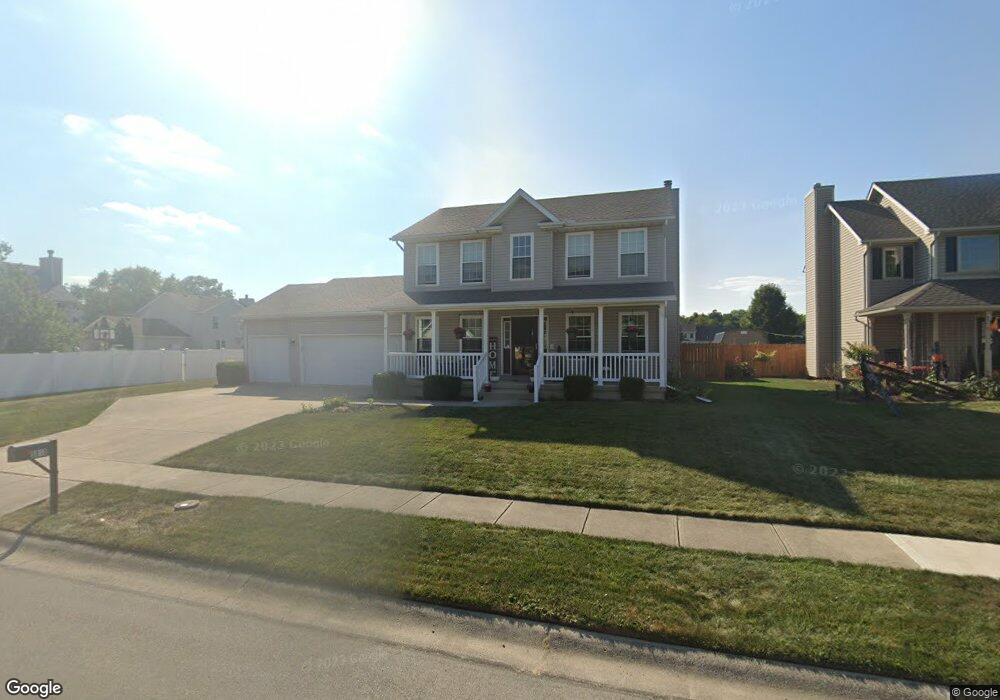
5815 Ridgewood Rd W Springfield, OH 45502
Estimated Value: $343,000 - $378,000
3
Beds
4
Baths
1,675
Sq Ft
$218/Sq Ft
Est. Value
About This Home
This home is located at 5815 Ridgewood Rd W, Springfield, OH 45502 and is currently estimated at $364,407, approximately $217 per square foot. 5815 Ridgewood Rd W is a home located in Clark County with nearby schools including Northridge Elementary School, Kenton Ridge Middle & High School, and Emmanuel Christian Academy.
Ownership History
Date
Name
Owned For
Owner Type
Purchase Details
Closed on
Nov 18, 2015
Sold by
Perks David and Perks Stacy D
Bought by
Deel Todd M and Deel Carla J
Current Estimated Value
Home Financials for this Owner
Home Financials are based on the most recent Mortgage that was taken out on this home.
Original Mortgage
$180,775
Outstanding Balance
$140,761
Interest Rate
3.74%
Mortgage Type
VA
Estimated Equity
$223,646
Purchase Details
Closed on
Sep 27, 2012
Sold by
Perks Erin
Bought by
Perks Davi
Purchase Details
Closed on
Oct 16, 2003
Sold by
Weldon G Haney Builder Inc
Bought by
Perks David and Perks Erin
Home Financials for this Owner
Home Financials are based on the most recent Mortgage that was taken out on this home.
Original Mortgage
$176,828
Interest Rate
7.85%
Mortgage Type
Purchase Money Mortgage
Purchase Details
Closed on
Oct 11, 2003
Sold by
Theodor Derek and Theodor Erin
Bought by
Weldon G Haney Builder Inc
Home Financials for this Owner
Home Financials are based on the most recent Mortgage that was taken out on this home.
Original Mortgage
$176,828
Interest Rate
7.85%
Mortgage Type
Purchase Money Mortgage
Create a Home Valuation Report for This Property
The Home Valuation Report is an in-depth analysis detailing your home's value as well as a comparison with similar homes in the area
Home Values in the Area
Average Home Value in this Area
Purchase History
| Date | Buyer | Sale Price | Title Company |
|---|---|---|---|
| Deel Todd M | $175,000 | Towne Title | |
| Perks Davi | -- | None Available | |
| Perks David | $176,900 | -- | |
| Weldon G Haney Builder Inc | -- | -- |
Source: Public Records
Mortgage History
| Date | Status | Borrower | Loan Amount |
|---|---|---|---|
| Open | Deel Todd M | $180,775 | |
| Closed | Perks David | $176,828 |
Source: Public Records
Tax History
| Year | Tax Paid | Tax Assessment Tax Assessment Total Assessment is a certain percentage of the fair market value that is determined by local assessors to be the total taxable value of land and additions on the property. | Land | Improvement |
|---|---|---|---|---|
| 2025 | $4,141 | $102,060 | $18,360 | $83,700 |
| 2024 | $3,908 | $92,360 | $16,520 | $75,840 |
| 2023 | $3,908 | $92,360 | $16,520 | $75,840 |
| 2022 | $3,922 | $92,360 | $16,520 | $75,840 |
| 2021 | $3,837 | $76,590 | $12,610 | $63,980 |
| 2020 | $3,841 | $76,590 | $12,610 | $63,980 |
| 2019 | $3,914 | $76,590 | $12,610 | $63,980 |
| 2018 | $3,440 | $64,600 | $12,610 | $51,990 |
| 2017 | $2,948 | $66,297 | $12,614 | $53,683 |
| 2016 | $2,926 | $66,297 | $12,614 | $53,683 |
| 2015 | $3,096 | $64,701 | $12,614 | $52,087 |
| 2014 | $3,096 | $64,701 | $12,614 | $52,087 |
| 2013 | $3,025 | $64,701 | $12,614 | $52,087 |
Source: Public Records
Map
Nearby Homes
- 1325 Northfield Ct
- 5722 Victorian Way Unit 31
- 5564 Ridgewood Rd W
- 937 Willow Rd
- Pendleton Plan at
- Holcombe Plan at
- Newcastle Plan at
- Chatham Plan at
- 1470 Oldham Dr Unit 12
- 5564 Ridgewood Rd E Unit 7
- 1707 Berwick Dr
- 1836 Dunseth Ln
- 1709 Thomas Dr
- 4741 Cullen Ave
- 1033 Westmont Cir
- 4652 Reno Ln Unit 15
- 862 Brendle Trace Unit 20
- 4446 Ridgewood Rd E Unit 3
- 4343 Burchill St
- 593 Hiser Ave
- 5831 Ridgewood Rd W
- 1340 Westview Ave
- 1336 Westview Ave
- 5847 Ridgewood Rd W
- 1332 Westview Ave
- 5808 Ridgewood Rd W
- 5824 Ridgewood Rd W
- 5824 W Ridgewood Rd
- 5863 Ridgewood Rd W
- 5792 Ridgewood Rd W
- 5840 Ridgewood Rd W
- 1328 Westview Ave
- 5776 Ridgewood Rd W
- 5856 Ridgewood Rd W
- 1324 Westview Ave
- 1341 Westview Ave
- 1337 Westview Ave
- 5791 Winfield Dr
- 5791 Winfield Dr Unit 50
- 5799 Winfield Dr Unit 51
Your Personal Tour Guide
Ask me questions while you tour the home.