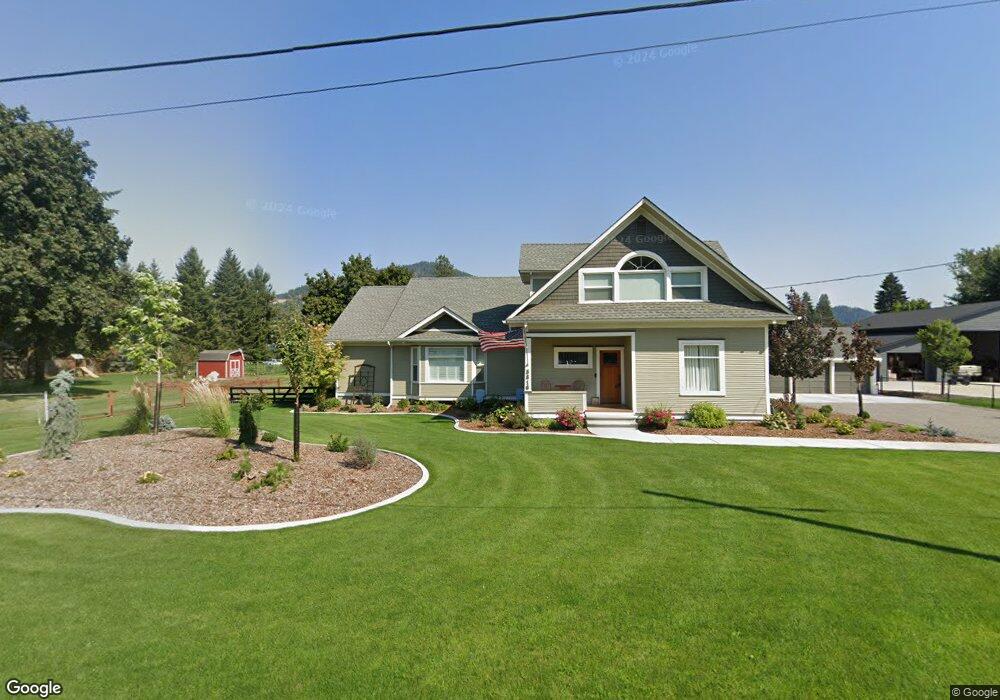
5816 N Davenport St Dalton Gardens, ID 83815
Estimated Value: $1,253,000 - $1,403,000
4
Beds
3
Baths
3,891
Sq Ft
$340/Sq Ft
Est. Value
About This Home
This home is located at 5816 N Davenport St, Dalton Gardens, ID 83815 and is currently estimated at $1,321,007, approximately $339 per square foot. 5816 N Davenport St is a home located in Kootenai County with nearby schools including Dalton Elementary School, Canfield Middle School, and Coeur d'Alene High School.
Ownership History
Date
Name
Owned For
Owner Type
Purchase Details
Closed on
Aug 14, 2019
Sold by
Lundy Denise L and Denis L Lundy Living Trust
Bought by
Baune Cory Richard and Baune Heather Ann
Current Estimated Value
Home Financials for this Owner
Home Financials are based on the most recent Mortgage that was taken out on this home.
Original Mortgage
$588,000
Outstanding Balance
$514,979
Interest Rate
3.7%
Mortgage Type
New Conventional
Estimated Equity
$806,028
Purchase Details
Closed on
Feb 13, 2014
Sold by
Lundy Denise L
Bought by
Lundy Denise L and Denise L Lundy Living Trust
Purchase Details
Closed on
Sep 22, 2009
Sold by
Lundy Denise L
Bought by
Lundy Denise L
Home Financials for this Owner
Home Financials are based on the most recent Mortgage that was taken out on this home.
Original Mortgage
$255,000
Interest Rate
5.25%
Mortgage Type
New Conventional
Create a Home Valuation Report for This Property
The Home Valuation Report is an in-depth analysis detailing your home's value as well as a comparison with similar homes in the area
Home Values in the Area
Average Home Value in this Area
Purchase History
| Date | Buyer | Sale Price | Title Company |
|---|---|---|---|
| Baune Cory Richard | -- | Titleone Boise | |
| Lundy Denise L | -- | Accommodation | |
| Lundy Denise L | -- | -- |
Source: Public Records
Mortgage History
| Date | Status | Borrower | Loan Amount |
|---|---|---|---|
| Open | Baune Cory Richard | $588,000 | |
| Previous Owner | Lundy Denise L | $255,000 |
Source: Public Records
Tax History Compared to Growth
Tax History
| Year | Tax Paid | Tax Assessment Tax Assessment Total Assessment is a certain percentage of the fair market value that is determined by local assessors to be the total taxable value of land and additions on the property. | Land | Improvement |
|---|---|---|---|---|
| 2024 | $4,206 | $1,180,258 | $350,000 | $830,258 |
| 2023 | $4,206 | $1,273,188 | $375,000 | $898,188 |
| 2022 | $5,176 | $1,318,476 | $375,000 | $943,476 |
| 2021 | $4,832 | $806,240 | $250,000 | $556,240 |
| 2020 | $4,801 | $710,160 | $200,000 | $510,160 |
| 2019 | $3,584 | $517,470 | $184,000 | $333,470 |
| 2018 | $3,524 | $467,620 | $160,000 | $307,620 |
| 2017 | $3,380 | $432,400 | $136,500 | $295,900 |
| 2016 | $3,368 | $416,220 | $130,000 | $286,220 |
| 2015 | $2,925 | $359,770 | $115,040 | $244,730 |
| 2013 | $2,765 | $319,040 | $93,150 | $225,890 |
Source: Public Records
Map
Nearby Homes
- 663 E Dalton Ave
- 850 E Trinity Ct
- 5775 N Colfax St
- 1283 N Center Green Loop
- 5615 N Colfax St
- 5687 N 15th St
- 6344 N Colfax St
- 1337 N Center Green Loop
- 5069 N Webster St
- NNA Hanley Ave
- 860 E Hoffman Ave
- 5155 N Ezy St
- 1298 E Hoffman Ave
- 6519 N Valley St
- 1772 E Hanley Ave
- 6655 N Coeur Terre Blvd
- 145 E Hanley Ave
- 6701 N Coeur Terre Blvd
- NKA E Violet Ave
- 4281 N Deerfield Dr
- 5856 N Davenport St
- 0 N Anne St
- 5815 N Davenport St
- 5776 N Davenport St
- 5767 N Davenport St
- 5879 N Davenport St
- 5904 N Davenport St
- 5735 N Davenport St
- 5903 N Davenport St
- 5928 N Davenport St
- 5695 N Davenport St
- 5815 N Mount Carrol St
- 5767 N Mt Carrol St
- 5767 N Mount Carrol St
- 5951 N Davenport St
- 5663 N Davenport St
- 5664 N Davenport St
- 5895 N Mount Carrol St
- 5984 N Davenport St
- 5848 Mt Carrol