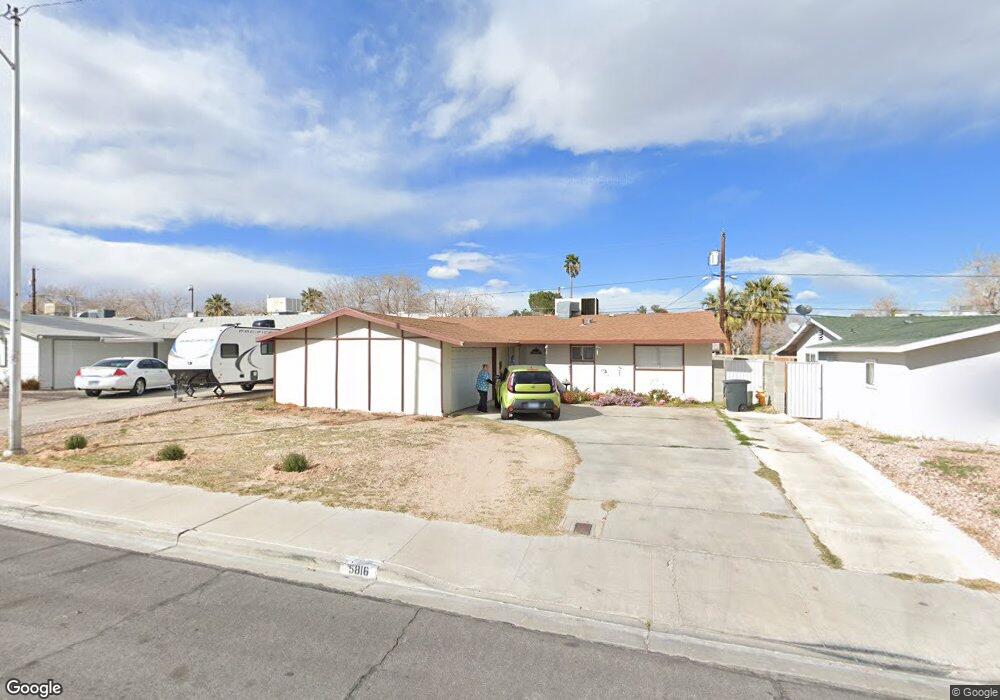
5816 Pebble Beach Blvd Las Vegas, NV 89108
Michael Way NeighborhoodEstimated Value: $338,552 - $377,000
3
Beds
2
Baths
1,188
Sq Ft
$302/Sq Ft
Est. Value
About This Home
This home is located at 5816 Pebble Beach Blvd, Las Vegas, NV 89108 and is currently estimated at $359,138, approximately $302 per square foot. 5816 Pebble Beach Blvd is a home located in Clark County with nearby schools including Paul E. Culley Elementary School, Robert O Gibson Middle School, and Western High School.
Ownership History
Date
Name
Owned For
Owner Type
Purchase Details
Closed on
Sep 3, 2024
Sold by
Ahey Thomas John and Ahey Nancy Lynn
Bought by
Achej Trust and Ahey
Current Estimated Value
Purchase Details
Closed on
Oct 27, 2008
Sold by
Ahey Nancy
Bought by
Ahey Thomas John and Ahey Nancy
Purchase Details
Closed on
Aug 2, 2002
Sold by
Macfarlane Jacqueline D
Bought by
Ahey Nancy
Purchase Details
Closed on
Jun 30, 1997
Sold by
Ahey Thomas John and Ahey Nancy Lynn
Bought by
Macfarlane David R and Macfarlane Jacqueline D
Home Financials for this Owner
Home Financials are based on the most recent Mortgage that was taken out on this home.
Original Mortgage
$90,250
Interest Rate
7.92%
Purchase Details
Closed on
Apr 29, 1997
Sold by
Ahey Thomas John and Ahey Nancy Lynn
Bought by
Macfarlane David Ringey and Macfarlane Jacqueline D
Create a Home Valuation Report for This Property
The Home Valuation Report is an in-depth analysis detailing your home's value as well as a comparison with similar homes in the area
Home Values in the Area
Average Home Value in this Area
Purchase History
| Date | Buyer | Sale Price | Title Company |
|---|---|---|---|
| Achej Trust | -- | None Listed On Document | |
| Ahey Thomas John | -- | None Available | |
| Ahey Nancy | -- | -- | |
| Macfarlane David R | $95,000 | Lawyers Title | |
| Macfarlane David Ringey | -- | -- |
Source: Public Records
Mortgage History
| Date | Status | Borrower | Loan Amount |
|---|---|---|---|
| Previous Owner | Macfarlane David R | $90,250 |
Source: Public Records
Tax History Compared to Growth
Tax History
| Year | Tax Paid | Tax Assessment Tax Assessment Total Assessment is a certain percentage of the fair market value that is determined by local assessors to be the total taxable value of land and additions on the property. | Land | Improvement |
|---|---|---|---|---|
| 2025 | $906 | $47,567 | $29,750 | $17,817 |
| 2024 | $839 | $47,567 | $29,750 | $17,817 |
| 2023 | $839 | $47,283 | $31,150 | $16,133 |
| 2022 | $777 | $36,786 | $22,400 | $14,386 |
| 2021 | $720 | $35,798 | $22,400 | $13,398 |
| 2020 | $666 | $36,129 | $23,100 | $13,029 |
| 2019 | $624 | $30,045 | $17,500 | $12,545 |
| 2018 | $595 | $30,358 | $18,550 | $11,808 |
| 2017 | $923 | $28,150 | $16,450 | $11,700 |
| 2016 | $559 | $22,864 | $11,550 | $11,314 |
| 2015 | $556 | $20,777 | $9,800 | $10,977 |
| 2014 | $540 | $15,980 | $5,250 | $10,730 |
Source: Public Records
Map
Nearby Homes
- 5809 Pebble Beach Blvd
- 5939 Vegas Dr
- 6008 Pebble Beach Blvd
- 1452 N Jones Blvd
- 1336 N Jones Blvd
- 1326 N Jones Blvd
- 1706 N Jones Blvd
- 1200 Saylor Way
- 1120 Saylor Way
- 1209 Shifting Sands Dr
- 1401 N Michael Way Unit 118
- 6208 Mandarin Dr
- 1116 N Jones Blvd
- 1105 Winwood St
- 6224 Mandarin Dr
- 1710 Shadow Mountain Place
- 5317 Marietta Ave
- 5816 Marka Dr
- 912 Saylor Way
- 6205 Carmen Blvd
- 5812 Pebble Beach Blvd
- 5820 Pebble Beach Blvd
- 5808 Pebble Beach Blvd
- 5824 Pebble Beach Blvd
- 5915 Vegas Dr
- 5815 Vegas Dr
- 5913 Vegas Dr
- 5817 Vegas Dr
- 5817 Pebble Beach Blvd
- 5819 Vegas Dr
- 5909 Vegas Dr
- 5821 Pebble Beach Blvd
- 5813 Pebble Beach Blvd
- 5813 Pebble Beach Blvd Unit n/a
- 5804 Pebble Beach Blvd
- 5821 Vegas Dr
- 5900 Pebble Beach Blvd
- 5917 Vegas Dr
- 5907 Vegas Dr
- 5919 Vegas Dr