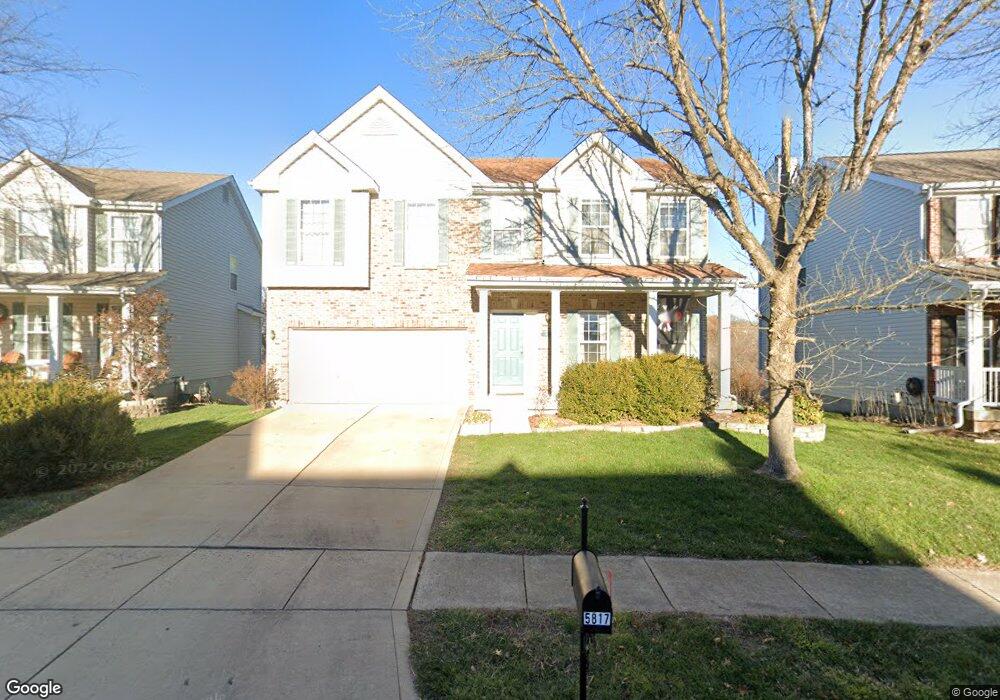
5817 Birchmont Place Dr Saint Louis, MO 63129
Estimated Value: $436,984 - $498,000
4
Beds
4
Baths
2,560
Sq Ft
$177/Sq Ft
Est. Value
About This Home
This home is located at 5817 Birchmont Place Dr, Saint Louis, MO 63129 and is currently estimated at $453,246, approximately $177 per square foot. 5817 Birchmont Place Dr is a home located in St. Louis County with nearby schools including Blades Elementary School, Bernard Middle School, and Oakville Senior High School.
Ownership History
Date
Name
Owned For
Owner Type
Purchase Details
Closed on
Sep 27, 2012
Sold by
Betz Scott Anthony
Bought by
Betz Scott Anthony
Current Estimated Value
Purchase Details
Closed on
Apr 8, 2011
Sold by
Betz Natividad A
Bought by
Betz Scott A
Purchase Details
Closed on
Jun 26, 2005
Sold by
Betz Scott A
Bought by
Betz Scott A and Betz Natividad A
Purchase Details
Closed on
Oct 21, 2002
Sold by
Betz Scott A and Betz Natividad A
Bought by
Betz Scott A
Home Financials for this Owner
Home Financials are based on the most recent Mortgage that was taken out on this home.
Original Mortgage
$116,224
Interest Rate
5.42%
Purchase Details
Closed on
Sep 6, 2001
Sold by
The Jones Company Custom Homes Inc
Bought by
Betz Scott A and Betz Natividad A
Home Financials for this Owner
Home Financials are based on the most recent Mortgage that was taken out on this home.
Original Mortgage
$120,000
Interest Rate
6.98%
Create a Home Valuation Report for This Property
The Home Valuation Report is an in-depth analysis detailing your home's value as well as a comparison with similar homes in the area
Home Values in the Area
Average Home Value in this Area
Purchase History
| Date | Buyer | Sale Price | Title Company |
|---|---|---|---|
| Betz Scott Anthony | -- | None Available | |
| Betz Scott A | -- | None Available | |
| Betz Scott A | -- | -- | |
| Betz Scott A | -- | -- | |
| Betz Scott A | $238,410 | -- |
Source: Public Records
Mortgage History
| Date | Status | Borrower | Loan Amount |
|---|---|---|---|
| Closed | Betz Scott A | $116,224 | |
| Closed | Betz Scott A | $120,000 |
Source: Public Records
Tax History Compared to Growth
Tax History
| Year | Tax Paid | Tax Assessment Tax Assessment Total Assessment is a certain percentage of the fair market value that is determined by local assessors to be the total taxable value of land and additions on the property. | Land | Improvement |
|---|---|---|---|---|
| 2025 | $4,771 | $78,420 | $18,470 | $59,950 |
| 2024 | $4,771 | $71,140 | $13,850 | $57,290 |
| 2023 | $4,710 | $71,140 | $13,850 | $57,290 |
| 2022 | $3,809 | $57,760 | $10,010 | $47,750 |
| 2021 | $3,686 | $57,760 | $10,010 | $47,750 |
| 2020 | $3,634 | $54,160 | $8,460 | $45,700 |
| 2019 | $3,623 | $54,160 | $8,460 | $45,700 |
| 2018 | $3,617 | $48,820 | $7,700 | $41,120 |
| 2017 | $3,612 | $48,820 | $7,700 | $41,120 |
| 2016 | $3,763 | $48,820 | $7,700 | $41,120 |
| 2015 | $3,454 | $48,820 | $7,700 | $41,120 |
| 2014 | $3,747 | $52,460 | $8,280 | $44,180 |
Source: Public Records
Map
Nearby Homes
- 5735 Dove Meadow Ln
- 4694 Baumgartner Rd
- 4121 Old Baumgartner Rd
- 5723 Hidden Stone Dr
- 5908 Oakville Woods Place
- 5581 Baronridge Dr Unit 5
- 5569 Baronridge Dr Unit 10
- 2840 Blackforest Dr Unit B
- 2832 Blackforest Dr Unit D
- 2804 Blackforest Dr Unit A
- 2777 Blackforest Dr Unit C
- 2793 Blackforest Dr Unit B
- 2781 Blackforest Dr Unit C
- 2781 Blackforest Dr Unit B
- 6018 Gatling Dr
- 5788 Westphalia Ln Unit 5788
- 2745 Westphalia Ct Unit F
- 5766 Westphalia Ln Unit C
- 2708 Blackforest Dr
- 2766 Chalet Hill Dr
- 5813 Birchmont Place Dr
- 5821 Birchmont Place Dr
- 5825 Birchmont Place Dr
- 5809 Birchmont Place Dr
- 5814 Birchmont Place Dr
- 5829 Birchmont Place Dr
- 5810 Birchmont Place Dr
- 5805 Birchmont Place Dr
- 5830 Birchmont Place Dr
- 5833 Birchmont Place Dr
- 5801 Birchmont Place Dr
- 5782 Birchmont Place Dr
- 5834 Birchmont Place Dr
- 5770 Birchmont Place Dr
- 5837 Birchmont Place Dr
- 5797 Birchmont Place Dr
- 5774 Birchmont Place Dr
- 5766 Birchmont Place Dr
- 5842 Birchmont Place Dr
- 5841 Birchmont Place Dr