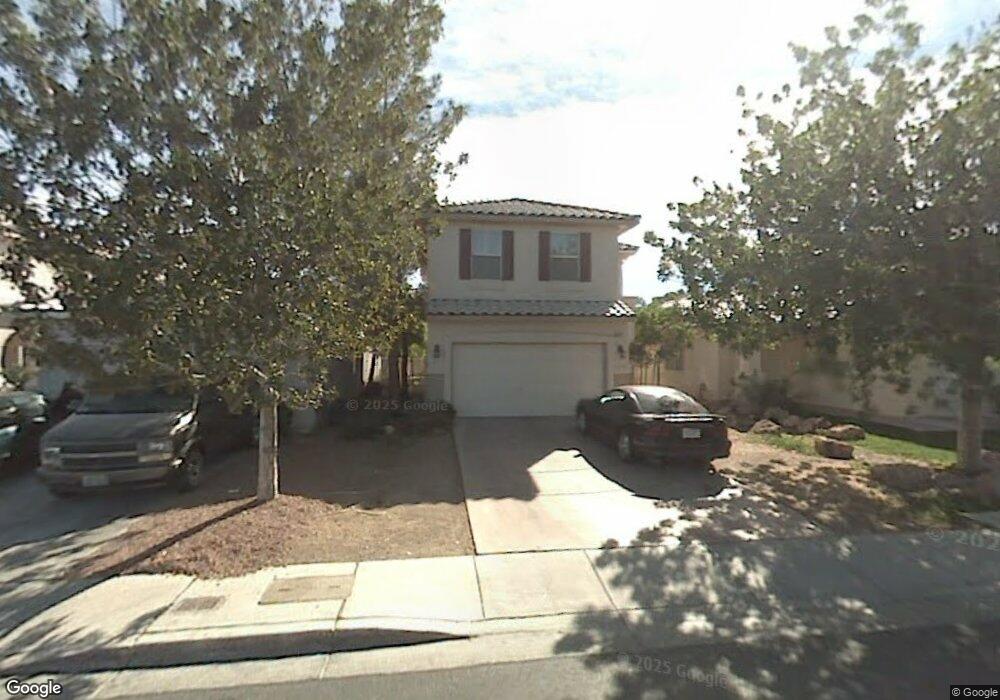
5817 Hickory Nut Ave Las Vegas, NV 89142
Estimated Value: $367,101 - $390,000
3
Beds
3
Baths
1,505
Sq Ft
$252/Sq Ft
Est. Value
About This Home
This home is located at 5817 Hickory Nut Ave, Las Vegas, NV 89142 and is currently estimated at $379,025, approximately $251 per square foot. 5817 Hickory Nut Ave is a home located in Clark County with nearby schools including John F. Mendoza Elementary School, Duane D. Keller Middle School, and Las Vegas High School.
Ownership History
Date
Name
Owned For
Owner Type
Purchase Details
Closed on
Sep 7, 2005
Sold by
Matallana Diego and Ramirez Sanjuana
Bought by
Zelaya Ana M
Current Estimated Value
Home Financials for this Owner
Home Financials are based on the most recent Mortgage that was taken out on this home.
Original Mortgage
$229,600
Outstanding Balance
$128,488
Interest Rate
6.59%
Mortgage Type
Unknown
Estimated Equity
$250,537
Purchase Details
Closed on
Nov 4, 2004
Sold by
Matallana Diego R
Bought by
Matallana Diego and Ramirez Sanjuana
Home Financials for this Owner
Home Financials are based on the most recent Mortgage that was taken out on this home.
Original Mortgage
$178,500
Interest Rate
5.7%
Mortgage Type
Unknown
Purchase Details
Closed on
Apr 29, 1999
Sold by
Lewis Properties
Bought by
Matallana Diego R
Home Financials for this Owner
Home Financials are based on the most recent Mortgage that was taken out on this home.
Original Mortgage
$124,150
Interest Rate
6.98%
Create a Home Valuation Report for This Property
The Home Valuation Report is an in-depth analysis detailing your home's value as well as a comparison with similar homes in the area
Home Values in the Area
Average Home Value in this Area
Purchase History
| Date | Buyer | Sale Price | Title Company |
|---|---|---|---|
| Zelaya Ana M | $287,000 | Ticor Title Of Nevada Inc | |
| Matallana Diego | $46,683 | Old Republic Title Co Of Nv | |
| Matallana Diego R | $128,000 | -- |
Source: Public Records
Mortgage History
| Date | Status | Borrower | Loan Amount |
|---|---|---|---|
| Open | Zelaya Ana M | $229,600 | |
| Previous Owner | Matallana Diego | $178,500 | |
| Previous Owner | Matallana Diego R | $124,150 |
Source: Public Records
Tax History Compared to Growth
Tax History
| Year | Tax Paid | Tax Assessment Tax Assessment Total Assessment is a certain percentage of the fair market value that is determined by local assessors to be the total taxable value of land and additions on the property. | Land | Improvement |
|---|---|---|---|---|
| 2025 | $1,734 | $78,254 | $23,800 | $54,454 |
| 2024 | $1,621 | $78,254 | $23,800 | $54,454 |
| 2023 | $1,140 | $77,867 | $26,250 | $51,617 |
| 2022 | $1,515 | $69,742 | $22,400 | $47,342 |
| 2021 | $1,668 | $64,726 | $19,600 | $45,126 |
| 2020 | $1,059 | $63,029 | $18,200 | $44,829 |
| 2019 | $993 | $60,271 | $16,100 | $44,171 |
| 2018 | $947 | $55,042 | $12,600 | $42,442 |
| 2017 | $1,537 | $52,415 | $11,550 | $40,865 |
| 2016 | $1,140 | $46,667 | $8,400 | $38,267 |
| 2015 | $1,137 | $34,546 | $6,650 | $27,896 |
| 2014 | $1,111 | $30,529 | $5,250 | $25,279 |
Source: Public Records
Map
Nearby Homes
- 5913 Autumn Harvest Ave
- 5794 Sea Breeze Ave
- 1631 Mapleleaf St
- 1361 Elaine Dr
- 1259 Plum Canyon St
- 1487 Elaine Dr
- 1291 Orange Meadow St
- 1148 Orchard View St Unit 2
- 5583 Orchard Ln Unit 152
- 5600 Orchard Ln
- 1747 Angel Falls St
- 6053 Wild Berry Dr
- 6058 Grape Blossom Ave
- 5564 Orchard Ln Unit 133
- 5849 Emerald Canyon Dr
- 6094 Bing Cherry Dr
- 6092 Golden Nectar Way
- 1728 S Christy Ln
- 1841 Skywood Way
- 5444 Alpaca Cir
- 5825 Hickory Nut Ave
- 5809 Hickory Nut Ave
- 5833 Hickory Nut Ave
- 5801 Hickory Nut Ave
- 5818 Autumn Harvest Ave
- 5841 Hickory Nut Ave
- 5810 Autumn Harvest Ave
- 5826 Autumn Harvest Ave
- 5802 Autumn Harvest Ave
- 1365 Hazel Tree Ct
- 5849 Hickory Nut Ave
- 1360 Hazel Tree Ct
- 5857 Hickory Nut Ave
- 5850 Autumn Harvest Ave
- 1350 Hazel Tree Ct
- 5865 Hickory Nut Ave
- 5858 Autumn Harvest Ave
- 1345 Hazel Tree Ct
- 1340 Hazel Tree Ct