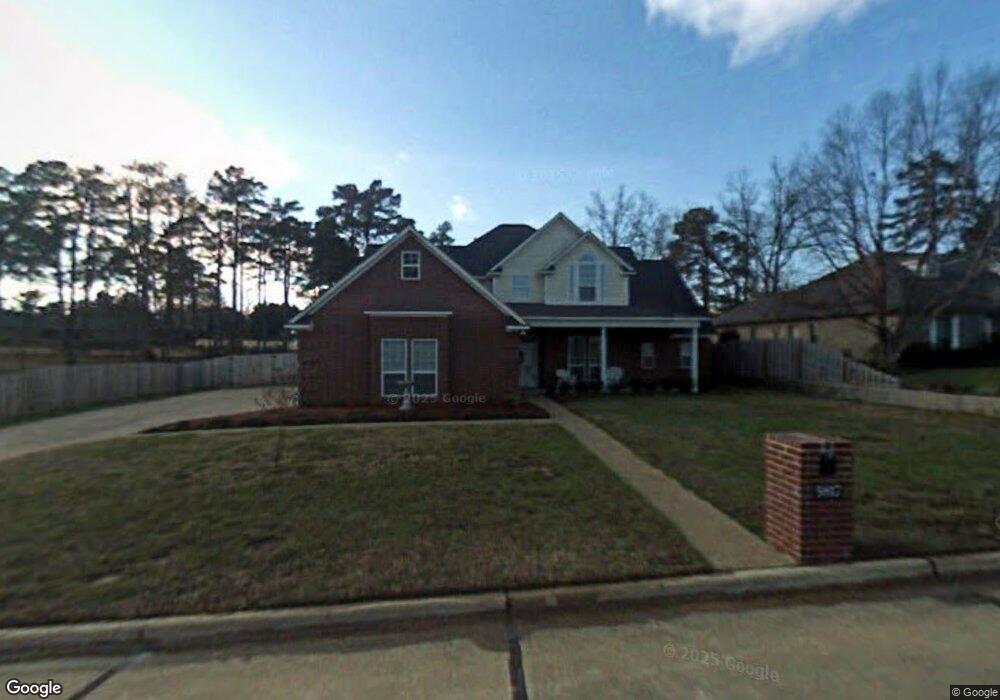
5817 Winchester Dr Texarkana, TX 75503
Estimated Value: $478,219 - $582,000
--
Bed
--
Bath
3,268
Sq Ft
$160/Sq Ft
Est. Value
About This Home
This home is located at 5817 Winchester Dr, Texarkana, TX 75503 and is currently estimated at $522,305, approximately $159 per square foot. 5817 Winchester Dr is a home located in Bowie County with nearby schools including Waggoner Creek Elementary School, Texas Middle School, and Texas High School.
Ownership History
Date
Name
Owned For
Owner Type
Purchase Details
Closed on
Oct 31, 2017
Sold by
Warden Laquita K and Estate Of Michael Warden
Bought by
Warden Laquta K and Warden Michael
Current Estimated Value
Purchase Details
Closed on
Jan 16, 2007
Sold by
J & M Poultry Inc
Bought by
Warden Michael Leo and Warden Laquita K
Home Financials for this Owner
Home Financials are based on the most recent Mortgage that was taken out on this home.
Original Mortgage
$200,000
Outstanding Balance
$118,720
Interest Rate
6.09%
Mortgage Type
New Conventional
Estimated Equity
$403,585
Purchase Details
Closed on
Mar 29, 2006
Sold by
Rommel Sea Fletcher and Rommel Jameson Joyce
Bought by
Riley Michael L and Riley Ationette R
Create a Home Valuation Report for This Property
The Home Valuation Report is an in-depth analysis detailing your home's value as well as a comparison with similar homes in the area
Home Values in the Area
Average Home Value in this Area
Purchase History
| Date | Buyer | Sale Price | Title Company |
|---|---|---|---|
| Warden Laquta K | -- | None Available | |
| Warden Michael Leo | -- | Twin City Title Co Inc | |
| Riley Michael L | -- | None Available |
Source: Public Records
Mortgage History
| Date | Status | Borrower | Loan Amount |
|---|---|---|---|
| Open | Warden Michael Leo | $200,000 | |
| Closed | Riley Michael L | $0 |
Source: Public Records
Tax History Compared to Growth
Tax History
| Year | Tax Paid | Tax Assessment Tax Assessment Total Assessment is a certain percentage of the fair market value that is determined by local assessors to be the total taxable value of land and additions on the property. | Land | Improvement |
|---|---|---|---|---|
| 2025 | $2,385 | $507,247 | $30,000 | $477,247 |
| 2024 | $2,385 | $492,615 | $30,000 | $463,610 |
| 2023 | $3,299 | $447,832 | $0 | $0 |
| 2022 | $9,718 | $435,400 | $30,000 | $405,400 |
| 2021 | $9,464 | $370,109 | $30,000 | $340,109 |
| 2020 | $9,198 | $357,810 | $30,000 | $327,810 |
| 2019 | $9,137 | $342,543 | $30,000 | $312,543 |
| 2018 | $8,810 | $334,059 | $30,000 | $304,059 |
| 2017 | $7,987 | $300,261 | $30,000 | $270,261 |
| 2016 | $7,987 | $300,261 | $30,000 | $270,261 |
| 2015 | $4,567 | $297,690 | $30,000 | $267,690 |
| 2014 | $4,567 | $287,679 | $30,000 | $257,679 |
Source: Public Records
Map
Nearby Homes
- 5818 Winchester Dr
- 5906 Winchester Dr
- 6404 N Park Rd
- 16 Bill Rogers Dr
- 5 Cindywood Dr
- 6705 N Park Rd
- 25 Shields Ct
- 24 Shields Ct
- 46 Enclave Cir
- 1521 Moores Ln
- 25 Enclave Cir
- 23 Enclave Cir
- 10 Enclave Cir
- 4 Enclave Cir
- 36 Enclave Cir
- 30 Enclave Cir
- 34 Enclave Cir
- 6 Enclave Cir
- 3 Enclave Cir
- 14 Enclave Cir
- 5815 Winchester Dr
- 5902 Winchester Dr
- 5813 Winchester Dr
- 5904 Winchester Dr
- 1 Bill Rogers Dr
- 5901 Winchester Dr
- 5816 Winchester Dr
- 5811 Winchester Dr
- 5907 Winchester Dr
- 5909 Winchester Dr
- 5809 Winchester Dr
- 5908 Winchester Dr
- 5911 Winchester Dr
- 5807 Winchester Dr
- 2 Northridge Cir
- 5913 Winchester Dr
- 1 Dreyer Place
- 5812 Winchester Dr
- 5805 Winchester Dr
- 1 Northridge Cir