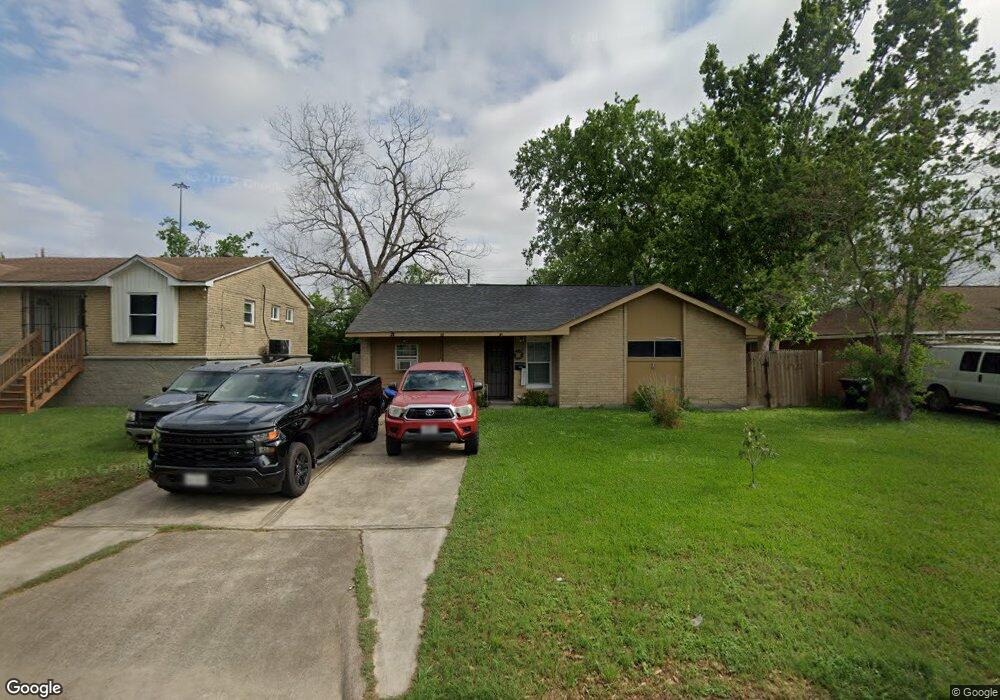
5818 Arthington St Houston, TX 77053
Fort Bend Houston NeighborhoodEstimated Value: $171,500 - $207,000
3
Beds
1
Bath
1,026
Sq Ft
$184/Sq Ft
Est. Value
About This Home
This home is located at 5818 Arthington St, Houston, TX 77053 and is currently estimated at $188,375, approximately $183 per square foot. 5818 Arthington St is a home located in Fort Bend County with nearby schools including Ridgegate Elementary School, Christa McAuliffe Middle School, and Willowridge High School.
Ownership History
Date
Name
Owned For
Owner Type
Purchase Details
Closed on
Nov 25, 2003
Sold by
Bayview Financial Property Trust
Bought by
Flores Joanne and Godinez Yolanda
Current Estimated Value
Home Financials for this Owner
Home Financials are based on the most recent Mortgage that was taken out on this home.
Original Mortgage
$56,000
Outstanding Balance
$13,002
Interest Rate
5.97%
Mortgage Type
Seller Take Back
Estimated Equity
$175,373
Purchase Details
Closed on
Mar 29, 2002
Sold by
Wizig Scott Enterprises Inc
Bought by
Flores Joanne and Yolanda Godinez
Purchase Details
Closed on
Mar 15, 2002
Sold by
Scott Wizig Enterprises Inc
Bought by
Bayview Financial Property Trust
Purchase Details
Closed on
Sep 5, 1995
Sold by
Taylor James D and Taylor Cheryl Lynn
Bought by
Scott Wizig Enterprise Inc
Create a Home Valuation Report for This Property
The Home Valuation Report is an in-depth analysis detailing your home's value as well as a comparison with similar homes in the area
Home Values in the Area
Average Home Value in this Area
Purchase History
| Date | Buyer | Sale Price | Title Company |
|---|---|---|---|
| Flores Joanne | -- | Fidelity National Title | |
| Flores Joanne | -- | -- | |
| Bayview Financial Property Trust | -- | Fidelity National Title | |
| Scott Wizig Enterprise Inc | $10,309 | -- |
Source: Public Records
Mortgage History
| Date | Status | Borrower | Loan Amount |
|---|---|---|---|
| Open | Flores Joanne | $56,000 | |
| Closed | Flores Joanne | $63,000 |
Source: Public Records
Tax History Compared to Growth
Tax History
| Year | Tax Paid | Tax Assessment Tax Assessment Total Assessment is a certain percentage of the fair market value that is determined by local assessors to be the total taxable value of land and additions on the property. | Land | Improvement |
|---|---|---|---|---|
| 2025 | $3,348 | $140,502 | $21,840 | $118,662 |
| 2024 | $3,348 | $173,661 | $21,840 | $151,821 |
| 2023 | $3,373 | $173,193 | $16,800 | $156,393 |
| 2022 | $2,937 | $138,560 | $16,800 | $121,760 |
| 2021 | $2,542 | $114,840 | $16,800 | $98,040 |
| 2020 | $2,689 | $119,220 | $16,800 | $102,420 |
| 2019 | $1,875 | $79,050 | $14,000 | $65,050 |
| 2018 | $1,832 | $77,210 | $14,000 | $63,210 |
| 2017 | $1,673 | $69,710 | $14,000 | $55,710 |
| 2016 | $1,514 | $63,070 | $14,000 | $49,070 |
| 2015 | $1,157 | $63,360 | $14,000 | $49,360 |
| 2014 | $970 | $52,880 | $14,000 | $38,880 |
Source: Public Records
Map
Nearby Homes
- 5734 Arthington St
- 6101 Maywood Dr
- 5605 Melanite Ave
- 15318 Corsair Rd
- 5710 W Ridgecreek Dr
- 15903 Lenclaire Dr
- 15806 Corsair Rd
- 5614 Condon Ln
- 15915 Dante Dr
- 5418 Arthington St
- 5774 Gineridge Dr
- 5619 Gineridge Dr
- 15610 Briar Spring Ct
- 15734 Briargate Ct
- 15406 Markwood Ct
- 5310 Ingomar Way
- 5622 Lycomb Dr
- 16226 Alden Ridge Dr
- 6018 Beaconridge Dr
- 16210 Rosenridge Dr
- 5822 Arthington St
- 5814 Arthington St
- 5810 Arthington St
- 5826 Arthington St
- 5806 Arthington St
- 5817 Arthington St
- 5821 Arthington St
- 5813 Arthington St
- 5809 Arthington St
- 5825 Arthington St
- 5802 Arthington St
- 5802 Arthington St
- 5805 Arthington St
- 5902 Arthington St
- 5738 Arthington St
- 5801 Arthington St
- 5818 Maywood Dr
- 5822 Maywood Dr
- 5814 Maywood Dr
- 5901 Arthington St