Estimated Value: $502,504 - $559,000
4
Beds
3
Baths
2,213
Sq Ft
$235/Sq Ft
Est. Value
About This Home
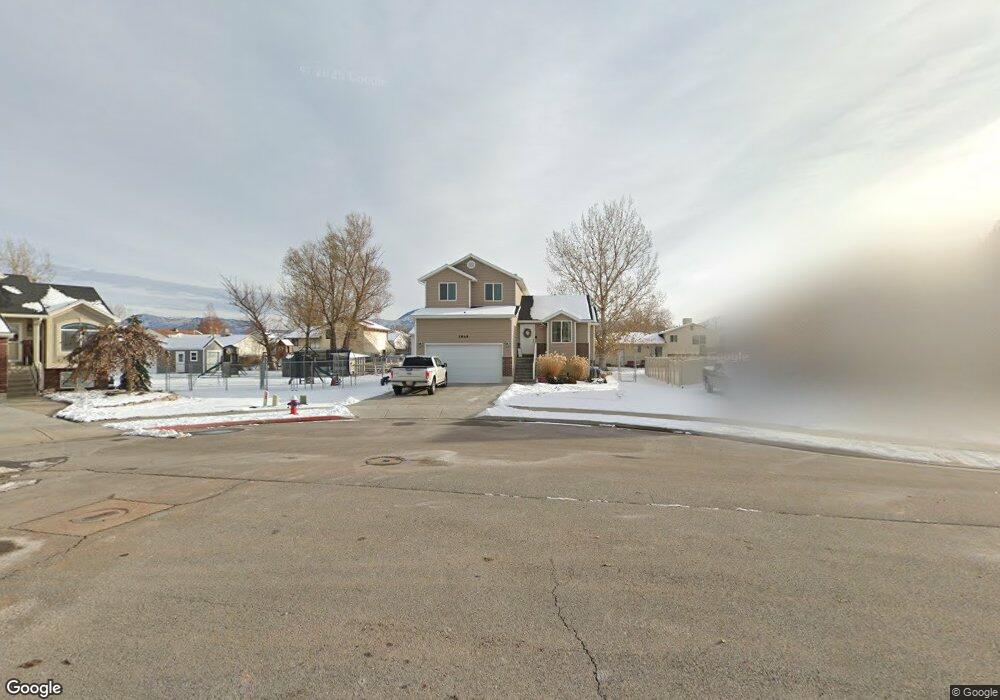
This home is located at 5818 S 4150 W, Roy, UT 84067 and is currently estimated at $520,376, approximately $235 per square foot. 5818 S 4150 W is a home located in Weber County with nearby schools including Freedom School, Roy Junior High School, and Roy High School.
Ownership History
Date
Name
Owned For
Owner Type
Purchase Details
Closed on
Aug 2, 2024
Sold by
Robles Alan Garcia
Bought by
Robles Alan Garcia and Day Jessica Marie
Current Estimated Value
Home Financials for this Owner
Home Financials are based on the most recent Mortgage that was taken out on this home.
Original Mortgage
$499,900
Outstanding Balance
$492,417
Interest Rate
6.87%
Mortgage Type
VA
Estimated Equity
$27,960
Purchase Details
Closed on
Feb 28, 2013
Sold by
Woodmere Homes Lc
Bought by
Haggard Cory J and Haggard Erica R
Home Financials for this Owner
Home Financials are based on the most recent Mortgage that was taken out on this home.
Original Mortgage
$176,051
Interest Rate
3.5%
Mortgage Type
FHA
Purchase Details
Closed on
Oct 19, 2012
Sold by
Pie Llc
Bought by
Woodmere Homes Lc
Purchase Details
Closed on
May 17, 2012
Sold by
2010 & 1 Radc Cade Property V Llc
Bought by
Pie Llc
Create a Home Valuation Report for This Property
The Home Valuation Report is an in-depth analysis detailing your home's value as well as a comparison with similar homes in the area
Home Values in the Area
Average Home Value in this Area
Purchase History
| Date | Buyer | Sale Price | Title Company |
|---|---|---|---|
| Robles Alan Garcia | -- | Stewart Title | |
| Robles Alan Garcia | -- | None Listed On Document | |
| Haggard Cory J | -- | Mountain View Title Ogden | |
| Woodmere Homes Lc | -- | Us Title Insurance Agency | |
| Pie Llc | -- | Us Title Insurance Agency |
Source: Public Records
Mortgage History
| Date | Status | Borrower | Loan Amount |
|---|---|---|---|
| Open | Robles Alan Garcia | $499,900 | |
| Previous Owner | Haggard Cory J | $176,051 |
Source: Public Records
Tax History
| Year | Tax Paid | Tax Assessment Tax Assessment Total Assessment is a certain percentage of the fair market value that is determined by local assessors to be the total taxable value of land and additions on the property. | Land | Improvement |
|---|---|---|---|---|
| 2025 | $272 | $496,263 | $157,490 | $338,773 |
| 2024 | $265 | $268,399 | $86,619 | $181,780 |
| 2023 | $3,145 | $282,700 | $86,217 | $196,483 |
| 2022 | $3,015 | $277,200 | $69,582 | $207,618 |
| 2021 | $2,609 | $396,000 | $86,105 | $309,895 |
| 2020 | $2,468 | $344,000 | $86,105 | $257,895 |
| 2019 | $2,210 | $288,000 | $55,862 | $232,138 |
| 2018 | $2,126 | $261,000 | $55,862 | $205,138 |
| 2017 | $2,031 | $234,000 | $55,862 | $178,138 |
| 2016 | $1,994 | $123,776 | $30,511 | $93,265 |
| 2015 | $1,759 | $111,187 | $30,511 | $80,676 |
| 2014 | $1,665 | $103,497 | $30,511 | $72,986 |
Source: Public Records
Map
Nearby Homes
Your Personal Tour Guide
Ask me questions while you tour the home.