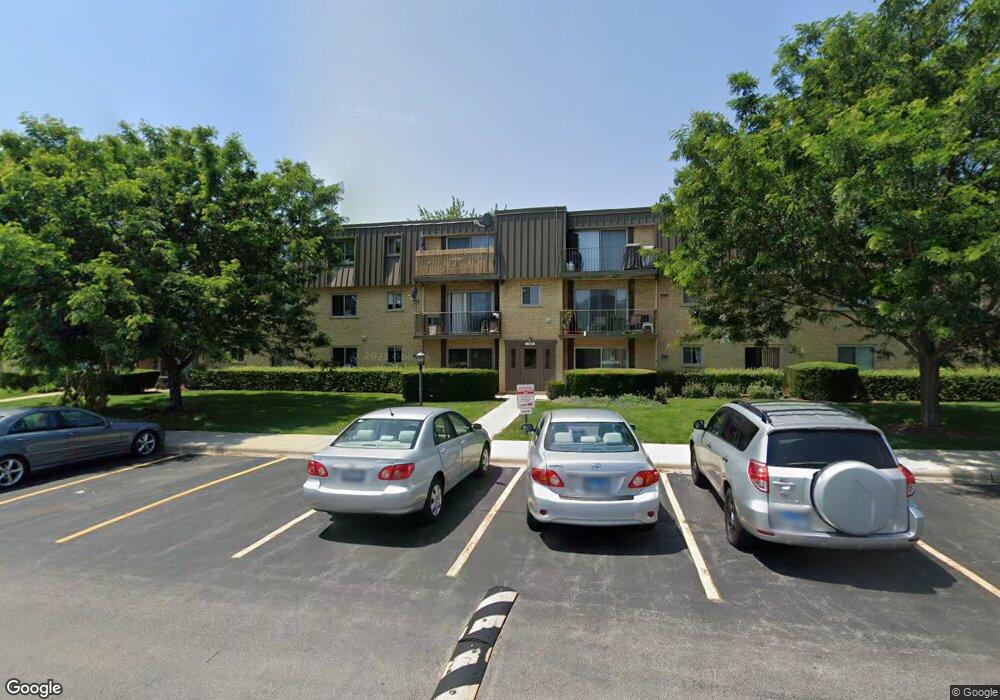
582 Fairway View Dr Unit 21G Wheeling, IL 60090
Estimated Value: $141,000 - $148,495
1
Bed
--
Bath
900
Sq Ft
$161/Sq Ft
Est. Value
About This Home
This home is located at 582 Fairway View Dr Unit 21G, Wheeling, IL 60090 and is currently estimated at $145,124, approximately $161 per square foot. 582 Fairway View Dr Unit 21G is a home located in Cook County with nearby schools including Joyce Kilmer Elementary School, Cooper Middle School, and Buffalo Grove High School.
Ownership History
Date
Name
Owned For
Owner Type
Purchase Details
Closed on
Jan 30, 2024
Sold by
Turchin Anton and Turchin Yana
Bought by
Mordan Management Llc
Current Estimated Value
Purchase Details
Closed on
Mar 18, 2015
Sold by
Turchin Anton and Turchin Yana
Bought by
Turchin Anton and Turchin Yana
Purchase Details
Closed on
Sep 3, 2014
Sold by
Fannie Mae
Bought by
Turchin Anton
Purchase Details
Closed on
Nov 22, 2013
Sold by
Whitecotton
Bought by
Federal National Mortgage Association
Purchase Details
Closed on
Nov 7, 2006
Sold by
Oac Properties Llc
Bought by
Whitecotton Emma
Home Financials for this Owner
Home Financials are based on the most recent Mortgage that was taken out on this home.
Original Mortgage
$111,820
Interest Rate
6.41%
Mortgage Type
Purchase Money Mortgage
Create a Home Valuation Report for This Property
The Home Valuation Report is an in-depth analysis detailing your home's value as well as a comparison with similar homes in the area
Home Values in the Area
Average Home Value in this Area
Purchase History
| Date | Buyer | Sale Price | Title Company |
|---|---|---|---|
| Mordan Management Llc | -- | None Listed On Document | |
| Turchin Anton | -- | None Available | |
| Turchin Anton | -- | First American Title | |
| Federal National Mortgage Association | -- | None Available | |
| Whitecotton Emma | -- | Chicago Title Insurance Co |
Source: Public Records
Mortgage History
| Date | Status | Borrower | Loan Amount |
|---|---|---|---|
| Previous Owner | Whitecotton Emma | $10,000 | |
| Previous Owner | Whitecotton Emma | $111,820 |
Source: Public Records
Tax History Compared to Growth
Tax History
| Year | Tax Paid | Tax Assessment Tax Assessment Total Assessment is a certain percentage of the fair market value that is determined by local assessors to be the total taxable value of land and additions on the property. | Land | Improvement |
|---|---|---|---|---|
| 2024 | $2,601 | $7,763 | $1,750 | $6,013 |
| 2023 | $2,481 | $7,763 | $1,750 | $6,013 |
| 2022 | $2,481 | $7,763 | $1,750 | $6,013 |
| 2021 | $1,795 | $4,844 | $291 | $4,553 |
| 2020 | $1,748 | $4,844 | $291 | $4,553 |
| 2019 | $1,776 | $5,421 | $291 | $5,130 |
| 2018 | $1,547 | $4,240 | $233 | $4,007 |
| 2017 | $1,516 | $4,240 | $233 | $4,007 |
| 2016 | $1,415 | $4,240 | $233 | $4,007 |
| 2015 | $1,443 | $4,049 | $991 | $3,058 |
| 2014 | $515 | $4,049 | $991 | $3,058 |
| 2013 | $456 | $4,049 | $991 | $3,058 |
Source: Public Records
Map
Nearby Homes
- 584 Fairway View Dr Unit 1I
- 571 Fairway View Dr Unit 2J
- 543 Wynn Ct Unit 3
- 565 Fairway View Dr Unit 2L
- 1144 Valley Stream Dr
- 550 Greystone Ln Unit A2
- 1059 Southbury Ln Unit 1
- 1062 Driftwood Ct Unit 1
- 1050 Southbury Ln Unit C2
- 1510 Seville Ct Unit A1
- 1502 Canbury Ct Unit D-1
- 1412 Shore Ct Unit C1
- 104 Steeple Dr Unit C
- 1005 Valley Stream Dr
- 220 Osage Ln
- 400 E Dundee Rd Unit 405C
- 108 Holly Ct
- 10 Old Oak Dr Unit 103
- 215 Woodstone Dr
- 493 Mchenry Rd Unit 3B
- 582 Fairway View Dr Unit 3H
- 582 Fairway View Dr Unit 22E
- 582 Fairway View Dr Unit 23G
- 582 Fairway View Dr Unit 21F
- 582 Fairway View Dr Unit 21E
- 582 Fairway View Dr Unit 23H
- 582 Fairway View Dr Unit 22F
- 582 Fairway View Dr Unit 23F
- 582 Fairway View Dr Unit 21H
- 582 Fairway View Dr Unit 23E
- 582 Fairway View Dr Unit 22G
- 582 Fairway View Dr Unit 22H
- 582 Fairway View Dr Unit 3G
- 582 Fairway View Dr Unit 3F
- 582 Fairway View Dr Unit 1F
- 582 Fairway View Dr Unit 1G
- 582 Fairway View Dr Unit 1E
- 580 Fairway View Dr Unit 23B
- 580 Fairway View Dr Unit 22C
- 580 Fairway View Dr Unit 21B