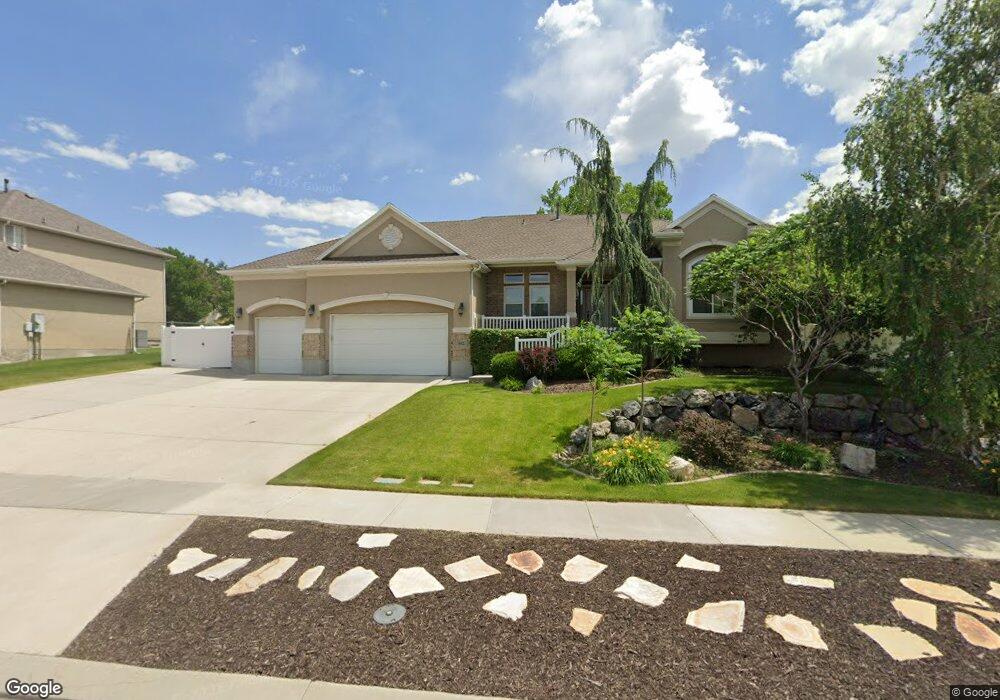
582 Hollow Creek Rd Draper, UT 84020
Estimated Value: $1,131,000 - $1,324,000
7
Beds
5
Baths
5,084
Sq Ft
$235/Sq Ft
Est. Value
About This Home
This home is located at 582 Hollow Creek Rd, Draper, UT 84020 and is currently estimated at $1,194,556, approximately $234 per square foot. 582 Hollow Creek Rd is a home located in Salt Lake County with nearby schools including Draper Elementary School, Corner Canyon High School, and Draper Park Middle School.
Ownership History
Date
Name
Owned For
Owner Type
Purchase Details
Closed on
Nov 12, 2021
Sold by
Christensen David M and Christens Jill
Bought by
David M Christensen And Jill E Christensen Fa and Christensen Jill E
Current Estimated Value
Home Financials for this Owner
Home Financials are based on the most recent Mortgage that was taken out on this home.
Original Mortgage
$66,415
Outstanding Balance
$51,493
Interest Rate
2.23%
Mortgage Type
New Conventional
Estimated Equity
$1,143,063
Purchase Details
Closed on
Sep 22, 2021
Sold by
Christensen David M and Christensen Jill E
Bought by
Christensen David M and Christensen David M
Home Financials for this Owner
Home Financials are based on the most recent Mortgage that was taken out on this home.
Original Mortgage
$66,415
Outstanding Balance
$51,493
Interest Rate
2.23%
Mortgage Type
New Conventional
Estimated Equity
$1,143,063
Purchase Details
Closed on
Mar 21, 2017
Sold by
Christensen David M and Christensen Jill E
Bought by
Christensen David M and Christensen Jill E
Purchase Details
Closed on
Feb 27, 2017
Sold by
Christensen David M and Christensen Jill E
Bought by
Chrstensen David M and Chrstensen Jill E
Purchase Details
Closed on
Aug 29, 2015
Sold by
Christensen David M and Christensen Jill
Bought by
Christensen David M and Christens Jill E
Purchase Details
Closed on
Oct 27, 2008
Sold by
Washington Mutual Bank
Bought by
Christensen David M and Christensen Jill
Home Financials for this Owner
Home Financials are based on the most recent Mortgage that was taken out on this home.
Original Mortgage
$200,000
Interest Rate
6.07%
Mortgage Type
Purchase Money Mortgage
Purchase Details
Closed on
Apr 14, 2008
Sold by
Sorensen Ben N and Sorensen Sharron C
Bought by
Washington Mutual Bank
Purchase Details
Closed on
Apr 11, 2001
Sold by
Sorensen Ben N and Sorensen Sharron C
Bought by
Sorensen Ben N and Sorensen Sharron C
Home Financials for this Owner
Home Financials are based on the most recent Mortgage that was taken out on this home.
Original Mortgage
$231,000
Interest Rate
7.09%
Create a Home Valuation Report for This Property
The Home Valuation Report is an in-depth analysis detailing your home's value as well as a comparison with similar homes in the area
Home Values in the Area
Average Home Value in this Area
Purchase History
| Date | Buyer | Sale Price | Title Company |
|---|---|---|---|
| David M Christensen And Jill E Christensen Fa | -- | Amrock | |
| Christensen David M | -- | None Available | |
| Christensen David M | -- | None Available | |
| Chrstensen David M | -- | None Available | |
| Christensen David M | -- | Northwest Title Agcy | |
| Christensen David M | -- | Highland Title Agency | |
| Washington Mutual Bank | $374,853 | None Available | |
| Sorensen Ben N | -- | Superior Title Company |
Source: Public Records
Mortgage History
| Date | Status | Borrower | Loan Amount |
|---|---|---|---|
| Open | David M Christensen And Jill E Christensen Fa | $66,415 | |
| Previous Owner | Christensen David M | $200,000 | |
| Previous Owner | Christensen David M | $200,000 | |
| Previous Owner | Sorensen Ben N | $231,000 |
Source: Public Records
Tax History Compared to Growth
Tax History
| Year | Tax Paid | Tax Assessment Tax Assessment Total Assessment is a certain percentage of the fair market value that is determined by local assessors to be the total taxable value of land and additions on the property. | Land | Improvement |
|---|---|---|---|---|
| 2025 | $4,665 | $1,008,100 | $294,800 | $713,300 |
| 2024 | $4,665 | $891,200 | $277,200 | $614,000 |
| 2023 | $4,273 | $810,200 | $243,900 | $566,300 |
| 2022 | $4,355 | $797,700 | $239,100 | $558,600 |
| 2021 | $4,386 | $686,200 | $194,500 | $491,700 |
| 2020 | $4,242 | $629,200 | $160,200 | $469,000 |
| 2019 | $3,876 | $561,700 | $160,200 | $401,500 |
| 2018 | $3,834 | $567,800 | $160,200 | $407,600 |
| 2017 | $3,691 | $523,700 | $144,100 | $379,600 |
| 2016 | $3,660 | $504,600 | $144,100 | $360,500 |
| 2015 | $3,836 | $489,800 | $140,400 | $349,400 |
| 2014 | $3,704 | $462,000 | $133,300 | $328,700 |
Source: Public Records
Map
Nearby Homes
- 598 Hollow Creek Rd
- 760 E Corner Ridge Dr
- 913 E Spiers Ln
- 14119 S Senior Band Rd
- 919 E Rocky Mouth Ln
- 928 E Rocky Mouth Ln
- 957 Senior Band Rd
- 455 E Rocky Mouth Ln
- 13888 S Wheadon Ct
- 14374 S Champ Cove Unit 138
- 13941 S Jarvie Ln
- 14044 Pepi Band Rd
- 328 E Tri Ln
- 14416 S Champ Cove
- 14669 S Faulkridge Ct Unit 106
- 14793 S Vintage View Ln Unit 14
- 13164 S City Point Cove Unit 1
- 1314 E Victor Ln
- 13189 S City Point Cove E Unit 4
- 1349 E Elk Unit 33
- 582 E Hollow Creek Rd
- 598 Hollow Creek Rd Unit 8
- 564 Hollow Creek Rd
- 616 Hollow Creek Rd
- 532 E Hollow Creek Rd
- 532 Hollow Creek Rd
- 577 E Hollow Creek Rd
- 577 Hollow Creek Rd
- 557 E Hollow Creek Rd
- 557 E Hollow Creek Rd
- 597 Hollow Creek Rd
- 527 Hollow Creek Rd
- 636 E Hollow Creek Rd
- 636 Hollow Creek Rd
- 527 E Hollow Creek Rd
- 613 Hollow Creek Rd
- 613 E Hollow Creek Rd
- 516 Hollow Creek Rd
- 516 E Hollow Creek Rd
- 641 E Rockwell Vista Unit 29