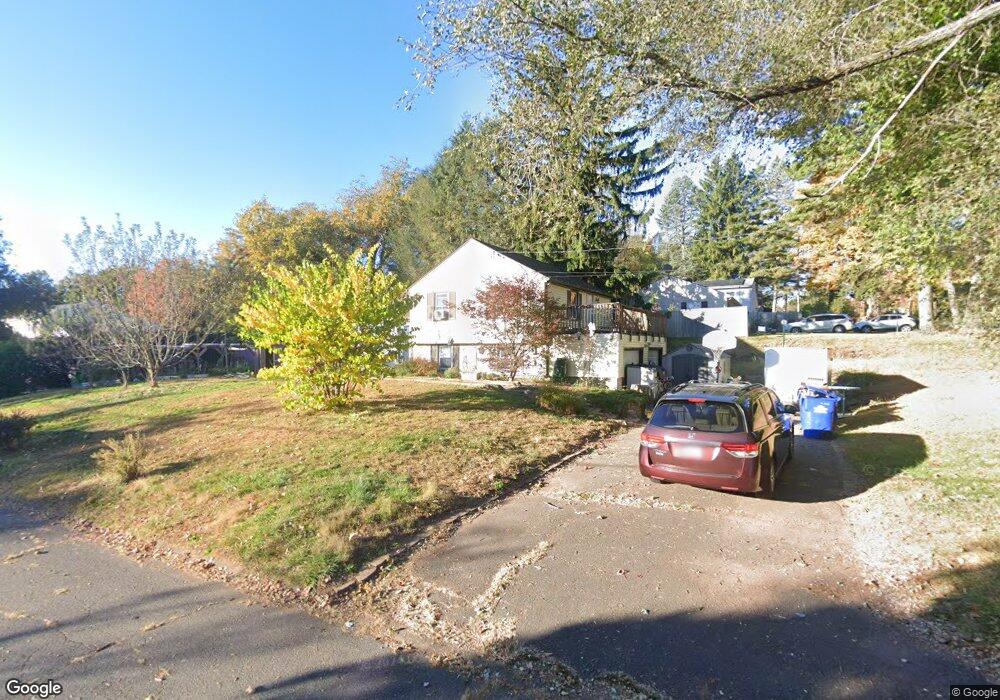
582 Spring St Southington, CT 06489
West Southington NeighborhoodEstimated Value: $358,000 - $376,642
3
Beds
3
Baths
1,122
Sq Ft
$329/Sq Ft
Est. Value
About This Home
This home is located at 582 Spring St, Southington, CT 06489 and is currently estimated at $369,411, approximately $329 per square foot. 582 Spring St is a home located in Hartford County with nearby schools including Reuben E. Thalberg Elementary School, Joseph A. Depaolo Middle School, and Southington High School.
Ownership History
Date
Name
Owned For
Owner Type
Purchase Details
Closed on
Jan 12, 2004
Sold by
Chute Michael
Bought by
Chamberland Marie
Current Estimated Value
Purchase Details
Closed on
Apr 21, 1987
Sold by
Riker Wayne
Bought by
Chute Michael
Home Financials for this Owner
Home Financials are based on the most recent Mortgage that was taken out on this home.
Original Mortgage
$100,000
Interest Rate
8.97%
Create a Home Valuation Report for This Property
The Home Valuation Report is an in-depth analysis detailing your home's value as well as a comparison with similar homes in the area
Home Values in the Area
Average Home Value in this Area
Purchase History
| Date | Buyer | Sale Price | Title Company |
|---|---|---|---|
| Chamberland Marie | $130,000 | -- | |
| Chute Michael | $140,000 | -- |
Source: Public Records
Mortgage History
| Date | Status | Borrower | Loan Amount |
|---|---|---|---|
| Open | Chute Michael | $240,000 | |
| Previous Owner | Chute Michael | $198,400 | |
| Previous Owner | Chute Michael | $103,500 | |
| Previous Owner | Chute Michael | $100,000 |
Source: Public Records
Tax History Compared to Growth
Tax History
| Year | Tax Paid | Tax Assessment Tax Assessment Total Assessment is a certain percentage of the fair market value that is determined by local assessors to be the total taxable value of land and additions on the property. | Land | Improvement |
|---|---|---|---|---|
| 2025 | $4,877 | $146,860 | $55,400 | $91,460 |
| 2024 | $4,617 | $146,860 | $55,400 | $91,460 |
| 2023 | $4,459 | $146,860 | $55,400 | $91,460 |
| 2022 | $4,278 | $146,860 | $55,400 | $91,460 |
| 2021 | $4,263 | $146,860 | $55,400 | $91,460 |
| 2020 | $4,234 | $138,230 | $56,530 | $81,700 |
| 2019 | $4,235 | $138,230 | $56,530 | $81,700 |
| 2018 | $4,213 | $138,230 | $56,530 | $81,700 |
| 2017 | $4,213 | $138,230 | $56,530 | $81,700 |
| 2016 | $4,097 | $138,230 | $56,530 | $81,700 |
| 2015 | $3,905 | $134,000 | $53,840 | $80,160 |
| 2014 | $3,800 | $134,000 | $53,840 | $80,160 |
Source: Public Records
Map
Nearby Homes
- 554 Spring St
- 62 Bagno Dr
- 110 W Pines Dr
- 61 Pine Hollow Dr
- 7 Meadow Rd
- 0 Winchester Estates Lot 17
- 47 Gannet Dr
- 1985 West St Unit 11
- 1985 West St Unit 9
- 81 Laning St
- 273 Queen St Unit 9A
- 285 Queen St Unit 4F
- 45 Hart St
- 27 Brookside Dr
- 103 Mountain Pond Rd
- 519 Village St
- 76 Kane St
- 206 Mountain Pond Rd
- 16 Brookside Dr
- 31 Erica Ct
- 572 Spring St
- 22 Summit Farms Rd
- 600 Spring St
- 562 Spring St
- 604 Spring St
- 38 Summit Farms Rd
- 616 Spring St
- 39 Summit Farms Rd
- 536 Spring St
- 54 Summit Farms Rd
- 25 Spring Hill Rd
- 628 Spring St
- 51 Summit Farms Rd
- 37 Spring Hill Rd
- 544 Spring St
- 72 Summit Farms Rd
- 49 Spring Hill Rd
- 63 Summit Farms Rd
- 88 Summit Farms Rd