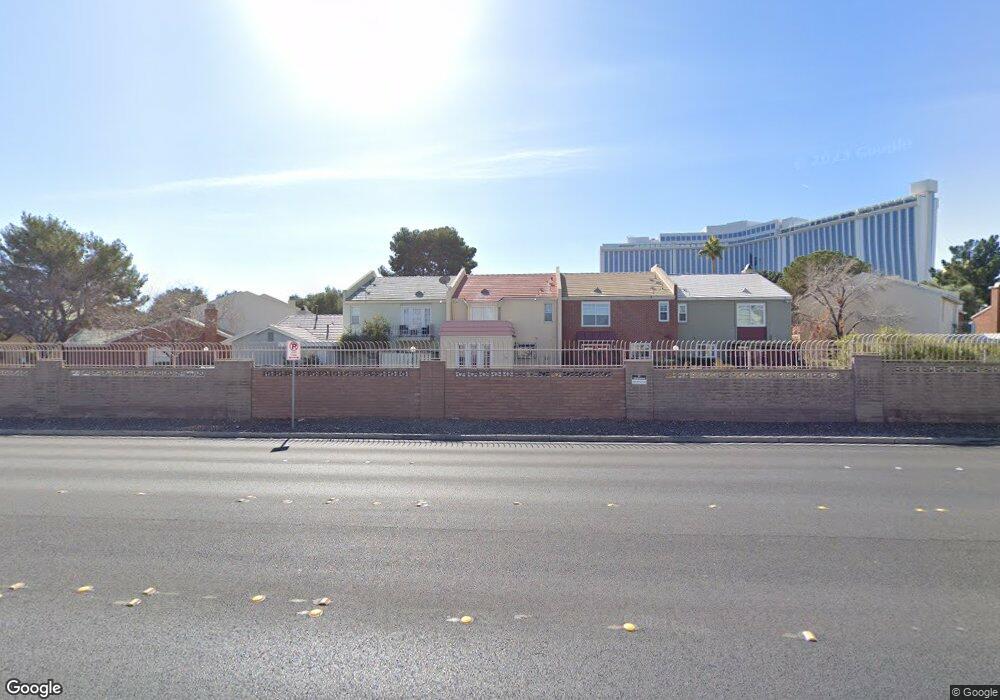
582 Tam o Shanter Las Vegas, NV 89109
Estimated Value: $377,000 - $421,000
3
Beds
2
Baths
1,800
Sq Ft
$218/Sq Ft
Est. Value
About This Home
This home is located at 582 Tam o Shanter, Las Vegas, NV 89109 and is currently estimated at $392,702, approximately $218 per square foot. 582 Tam o Shanter is a home located in Clark County with nearby schools including John S Park Elementary School, Roy West Martin Middle School, and Valley High School.
Ownership History
Date
Name
Owned For
Owner Type
Purchase Details
Closed on
May 9, 2023
Sold by
Jorgensen Rickard and Jorgensen Carol-Jeanette
Bought by
Rickard Jorgensen And Carol-Jeanette Jorgense
Current Estimated Value
Purchase Details
Closed on
Aug 23, 2022
Sold by
Amelia Boyadjieff Llc
Bought by
Jorgensen Rickard and Jorgensen Carol-Jeanette
Purchase Details
Closed on
Nov 13, 2020
Sold by
Boyadjieff Amelia E and The Amelia E Boyadjieff Revoca
Bought by
Amelia Boyadjieff Llc
Purchase Details
Closed on
May 31, 2019
Sold by
Amelia Boyadjieff Llc
Bought by
Boyadjieff Amelia E and The Amelia E Boyadjieff Revocable Trust
Purchase Details
Closed on
Dec 19, 2014
Sold by
Rae Robert A and Rae Doralee C
Bought by
Amelia Boyadjieff Llc
Purchase Details
Closed on
Jul 14, 2012
Sold by
Oneil Barry B and Knight Durrell
Bought by
Rae Robert A and Rae Doralee C
Purchase Details
Closed on
May 17, 2004
Sold by
Oneil Barry B
Bought by
Oneil Barry B and Knight Durrell
Create a Home Valuation Report for This Property
The Home Valuation Report is an in-depth analysis detailing your home's value as well as a comparison with similar homes in the area
Home Values in the Area
Average Home Value in this Area
Purchase History
| Date | Buyer | Sale Price | Title Company |
|---|---|---|---|
| Rickard Jorgensen And Carol-Jeanette Jorgense | -- | None Listed On Document | |
| Jorgensen Rickard | $380,000 | First American Title | |
| Amelia Boyadjieff Llc | -- | None Available | |
| Boyadjieff Amelia E | -- | None Available | |
| Amelia Boyadjieff Llc | $205,000 | Equity Title Of Nevada | |
| Rae Robert A | $127,500 | Lawyerst Tiel Of Nevada Vil | |
| Oneil Barry B | $98,351 | -- |
Source: Public Records
Tax History Compared to Growth
Tax History
| Year | Tax Paid | Tax Assessment Tax Assessment Total Assessment is a certain percentage of the fair market value that is determined by local assessors to be the total taxable value of land and additions on the property. | Land | Improvement |
|---|---|---|---|---|
| 2025 | $1,374 | $62,309 | $34,178 | $28,131 |
| 2024 | $1,374 | $62,309 | $34,178 | $28,131 |
| 2023 | $1,374 | $61,116 | $36,750 | $24,366 |
| 2022 | $1,272 | $48,739 | $26,093 | $22,646 |
| 2021 | $1,178 | $43,620 | $25,725 | $17,895 |
| 2020 | $1,091 | $44,069 | $25,725 | $18,344 |
| 2019 | $1,023 | $43,527 | $25,725 | $17,802 |
| 2018 | $976 | $39,766 | $22,050 | $17,716 |
| 2017 | $1,099 | $37,423 | $19,110 | $18,313 |
| 2016 | $915 | $36,288 | $16,538 | $19,750 |
| 2015 | $912 | $36,435 | $16,538 | $19,897 |
| 2014 | $883 | $29,176 | $10,290 | $18,886 |
Source: Public Records
Map
Nearby Homes
- 668 Oakmont Ave Unit 1715
- 668 Oakmont Ave Unit 1724
- 634 Oakmont Ave Unit 1903
- 669 Oakmont Ave Unit 3709
- 322 Karen Ave Unit 3407
- 322 Karen Ave Unit 2305
- 322 Karen Ave Unit 1507
- 322 Karen Ave Unit 205
- 322 Karen Ave Unit 802
- 322 Karen Ave Unit 1001
- 322 Karen Ave Unit 4408
- 322 Karen Ave Unit 1904
- 322 Karen Ave Unit 801
- 322 Karen Ave Unit 2807
- 322 Karen Ave Unit 4207
- 322 Karen Ave Unit 1903
- 322 Karen Ave Unit 903
- 322 Karen Ave Unit 807
- 322 Karen Ave Unit 2206
- 322 Karen Ave Unit 601
- 578 Tam o Shanter
- 584 Tam o Shanter Unit 50
- 586 Tam o Shanter
- 584 Tam o Shanter
- 584 Tam o Shanter
- 584 Tam o Shanter
- 596 Tam o Shanter Unit 46
- 594 Tam o Shanter Unit 47
- 600 Tam o Shanter
- 596 Tam o Shanter
- 596 Tam o Shanter
- 596 Tam o Shanter
- 576 Tam o Shanter
- 566 Tam o Shanter
- 570 Tam o Shanter
- 602 Tam o Shanter
- 608 Tam o Shanter
- 612 Tam o Shanter
- 606 Tam o Shanter
- 2690 Karen Ct