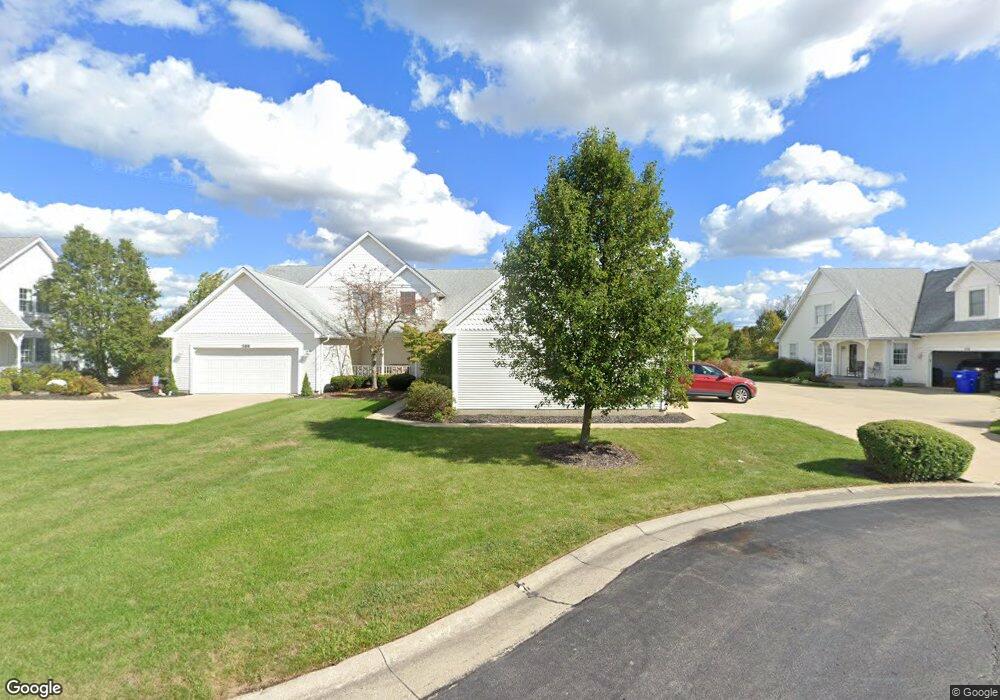
582 Vicksburg Ct Unit B5 Lagrange, OH 44050
Estimated Value: $223,000 - $307,000
2
Beds
3
Baths
1,851
Sq Ft
$140/Sq Ft
Est. Value
About This Home
This home is located at 582 Vicksburg Ct Unit B5, Lagrange, OH 44050 and is currently estimated at $259,004, approximately $139 per square foot. 582 Vicksburg Ct Unit B5 is a home located in Lorain County with nearby schools including Keystone Elementary School, Keystone Middle School, and Keystone High School.
Ownership History
Date
Name
Owned For
Owner Type
Purchase Details
Closed on
Jun 21, 2016
Sold by
Fleming R Shelley Stinson and Fleming Roger D
Bought by
Fleming R Shelley Stinson
Current Estimated Value
Purchase Details
Closed on
Nov 15, 2005
Sold by
Riccilli Carl A
Bought by
Fleming Roger D and Shelley Stinson Fleming R
Home Financials for this Owner
Home Financials are based on the most recent Mortgage that was taken out on this home.
Original Mortgage
$127,500
Outstanding Balance
$69,860
Interest Rate
6.04%
Mortgage Type
Purchase Money Mortgage
Estimated Equity
$189,145
Purchase Details
Closed on
Oct 9, 1998
Sold by
Union Station Land Co Inc
Bought by
Riccilli Carl A and Riccilli Faith K
Home Financials for this Owner
Home Financials are based on the most recent Mortgage that was taken out on this home.
Original Mortgage
$126,300
Interest Rate
6.78%
Create a Home Valuation Report for This Property
The Home Valuation Report is an in-depth analysis detailing your home's value as well as a comparison with similar homes in the area
Home Values in the Area
Average Home Value in this Area
Purchase History
| Date | Buyer | Sale Price | Title Company |
|---|---|---|---|
| Fleming R Shelley Stinson | -- | -- | |
| Fleming Roger D | -- | -- | |
| Fleming Roger D | $150,000 | -- | |
| Riccilli Carl A | $157,900 | Lorain County Title Co Inc |
Source: Public Records
Mortgage History
| Date | Status | Borrower | Loan Amount |
|---|---|---|---|
| Open | Fleming Roger D | $127,500 | |
| Closed | Riccilli Carl A | $126,300 |
Source: Public Records
Tax History Compared to Growth
Tax History
| Year | Tax Paid | Tax Assessment Tax Assessment Total Assessment is a certain percentage of the fair market value that is determined by local assessors to be the total taxable value of land and additions on the property. | Land | Improvement |
|---|---|---|---|---|
| 2024 | $2,838 | $66,973 | $11,900 | $55,073 |
| 2023 | $3,387 | $66,745 | $10,056 | $56,690 |
| 2022 | $3,365 | $66,745 | $10,056 | $56,690 |
| 2021 | $3,366 | $66,745 | $10,056 | $56,690 |
| 2020 | $3,288 | $58,090 | $8,750 | $49,340 |
| 2019 | $3,269 | $58,090 | $8,750 | $49,340 |
| 2018 | $3,154 | $58,090 | $8,750 | $49,340 |
| 2017 | $2,748 | $47,370 | $8,750 | $38,620 |
| 2016 | $2,225 | $47,370 | $8,750 | $38,620 |
| 2015 | $2,223 | $47,370 | $8,750 | $38,620 |
| 2014 | $1,961 | $47,370 | $8,750 | $38,620 |
| 2013 | $1,902 | $47,370 | $8,750 | $38,620 |
Source: Public Records
Map
Nearby Homes
- 128 Harvest Ct
- 516 Appomattox Ct
- 548 William St
- 433 N Center St
- 756 N Center St
- 607 Rundle St
- 171 Keywood Blvd
- 40725 Biggs Rd
- 630 Rundle St
- 829 Robinson Dr
- 831 Robinson Dr
- 822 Robinson Dr
- 808 Buckingham Dr
- 800 Buckingham Dr
- 194 Railroad St
- 0 Dill Ct Unit 5072837
- 110 Railroad St
- 41635 Parsons Rd
- 40175 Banks Rd
- 40185 Banks Rd
- 578 Vicksburg Ct Unit 6
- 586 Vicksburg Ct Unit B4
- 574 Vicksburg Ct Unit C7
- 590 Vicksburg Ct Unit A3
- 570 Vicksburg Ct Unit 8
- 594 Vicksburg Ct Unit A2
- 566 Vicksburg Ct Unit 9
- 559 Vicksburg Ct Unit 12
- 562 Vicksburg Ct Unit D10
- 598 Vicksburg Ct Unit A1
- 563 Vicksburg Ct Unit 12
- 595 Vicksburg Ct
- 599 Vicksburg Ct
- 0 Vicksburg Ct Unit 36435997
- 0 Vicksburg Ct
- 155 Manassas Jct
- 161 Manassas Jct
- S/L 5 Manassas Jct
- S/L 6 Manassas Jct
- S/L 7 Manassas Jct