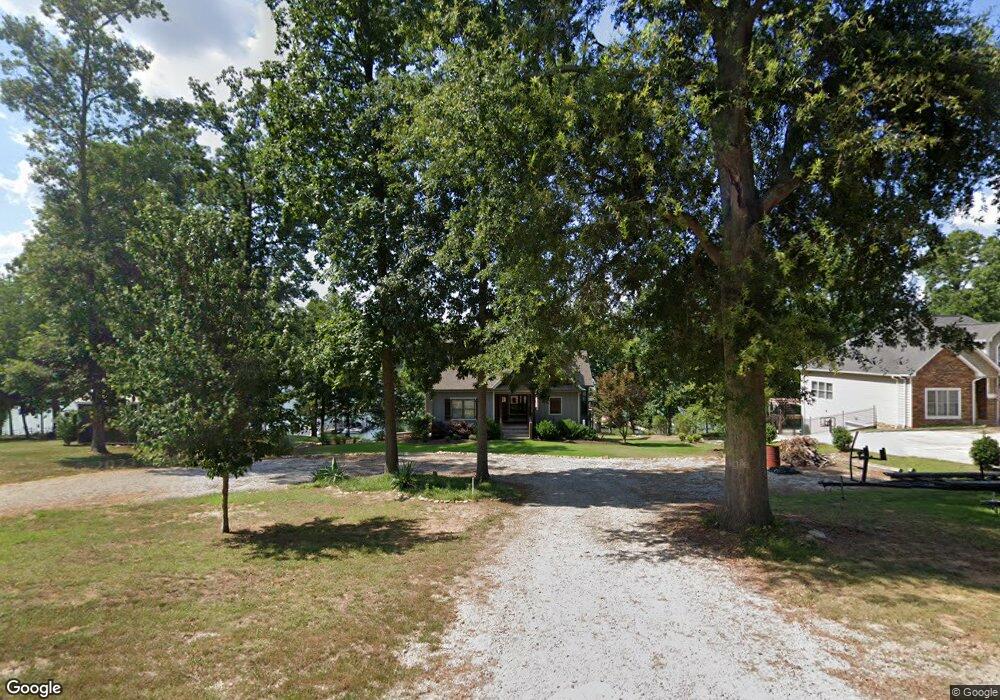
582 Whippoorwill Cir Lavonia, GA 30553
Estimated Value: $1,024,000 - $1,144,000
4
Beds
3
Baths
4,818
Sq Ft
$224/Sq Ft
Est. Value
About This Home
This home is located at 582 Whippoorwill Cir, Lavonia, GA 30553 and is currently estimated at $1,078,563, approximately $223 per square foot. 582 Whippoorwill Cir is a home located in Hart County with nearby schools including Hart County High School.
Ownership History
Date
Name
Owned For
Owner Type
Purchase Details
Closed on
Mar 26, 2021
Sold by
Cobiella Robert
Bought by
Cain William H
Current Estimated Value
Purchase Details
Closed on
Jun 17, 2014
Sold by
Wedean Prperties Inc
Bought by
Cobiella Robert
Home Financials for this Owner
Home Financials are based on the most recent Mortgage that was taken out on this home.
Original Mortgage
$72,750
Interest Rate
4.19%
Mortgage Type
New Conventional
Purchase Details
Closed on
Aug 7, 2012
Sold by
Westbrook Barry K
Bought by
Wedean Properties Inc
Purchase Details
Closed on
Mar 15, 2007
Sold by
Singleton R Chad
Bought by
Westbrook Barry K
Purchase Details
Closed on
Feb 16, 2007
Sold by
October Investments Llc
Bought by
Singleton R Chad
Purchase Details
Closed on
Jun 30, 2006
Sold by
Dove Fletcher A
Bought by
Tax Free Exchange Qi For Octob
Purchase Details
Closed on
Jun 1, 2000
Purchase Details
Closed on
Apr 1, 1961
Create a Home Valuation Report for This Property
The Home Valuation Report is an in-depth analysis detailing your home's value as well as a comparison with similar homes in the area
Home Values in the Area
Average Home Value in this Area
Purchase History
| Date | Buyer | Sale Price | Title Company |
|---|---|---|---|
| Cain William H | $704,000 | -- | |
| Cobiella Robert | $485,000 | -- | |
| Wedean Properties Inc | $129,765 | -- | |
| Westbrook Barry K | -- | -- | |
| Singleton R Chad | $314,745 | -- | |
| Tax Free Exchange Qi For Octob | $385,000 | -- | |
| -- | $170,000 | -- | |
| -- | -- | -- |
Source: Public Records
Mortgage History
| Date | Status | Borrower | Loan Amount |
|---|---|---|---|
| Previous Owner | Cobiella Robert | $72,750 | |
| Previous Owner | Cobiella Robert | $388,000 |
Source: Public Records
Tax History Compared to Growth
Tax History
| Year | Tax Paid | Tax Assessment Tax Assessment Total Assessment is a certain percentage of the fair market value that is determined by local assessors to be the total taxable value of land and additions on the property. | Land | Improvement |
|---|---|---|---|---|
| 2024 | $5,091 | $329,712 | $112,000 | $217,712 |
| 2023 | $4,986 | $299,426 | $112,000 | $187,426 |
| 2022 | $4,676 | $280,788 | $112,000 | $168,788 |
| 2021 | $3,932 | $213,954 | $76,000 | $137,954 |
| 2020 | $3,882 | $202,435 | $72,000 | $130,435 |
| 2019 | $3,746 | $193,668 | $68,000 | $125,668 |
| 2016 | $3,428 | $169,104 | $61,200 | $107,904 |
| 2015 | $3,370 | $184,631 | $69,600 | $115,031 |
| 2014 | $3,217 | $161,997 | $64,000 | $97,997 |
| 2013 | -- | $163,004 | $64,000 | $99,004 |
Source: Public Records
Map
Nearby Homes
- 142 Water Oak Dell Dr
- 679 Parkertown Heights Rd
- 714 Rocky Ford Rd
- 0 Walters Rd Unit 10589594
- 155 Collins Rd
- 0 Cherokee Cir Unit 10494817
- 170 Collins Rd
- 132 Cherokee Ln
- 0 Harbor Light Marina Rd Unit 20280801
- 0 Harbor Light Marina Rd Unit 10406821
- 44 Cherokee Plaza
- 3119 Rock Springs Rd
- 310 Park Place Dr Unit LOT 3
- 346 Park Place Dr Unit LOT 5
- 672 Tugaloo Heights Cir
- 672 Tugaloo Heights Cir Cir
- 346 Lake Club Cir
- 3.06 Acres S Carolina 11
- 11.28 Acres S Carolina 11
- 0 Bow Dr Unit 10349224
- 602 Whippoorwill Cir
- 568 Whippoorwill Cir
- 810 Whippoorwill Cir
- 33 Jollins Rd
- 512 Whippoorwill Cir
- 664 Whippoorwill Cir
- 502 Whippoorwill Cir
- 515 Whippoorwill Cir
- 690 Whippoorwill Cir
- 500 Whippoorwill Cir
- 673 Whippoorwill Cir
- 456 Whippoorwill Cir
- 470 Brookdale Dr
- 426 Whippoorwill Cir
- 426 Whippoorwill Cir
- 71 Brookdale Dr
- Lot 1 Brookdale Point
- 402 Whippoorwill Cir
- 763 Whippoorwill Cir
- 350 Whippoorwill Cir