Estimated Value: $170,000 - $181,112
3
Beds
1
Bath
1,016
Sq Ft
$172/Sq Ft
Est. Value
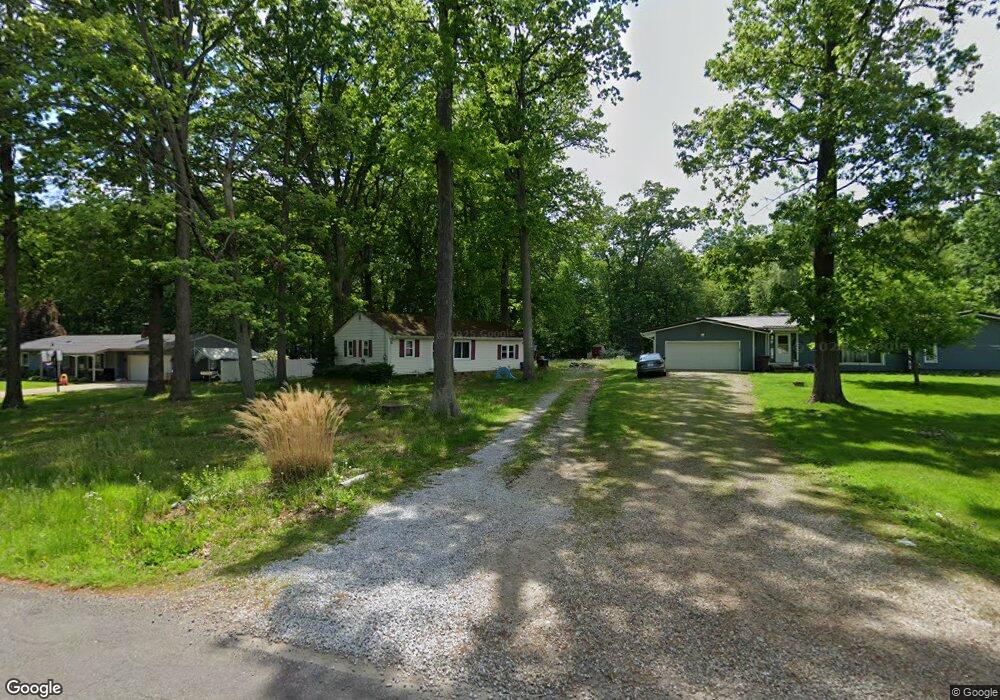
About This Home
This home is located at 5820 Myers Rd, Akron, OH 44319 and is currently estimated at $174,528, approximately $171 per square foot. 5820 Myers Rd is a home located in Summit County.
Ownership History
Date
Name
Owned For
Owner Type
Purchase Details
Closed on
Jul 15, 2019
Sold by
Bajcar Justin J and Bajcar Erika J
Bought by
Gass Mishella N
Current Estimated Value
Home Financials for this Owner
Home Financials are based on the most recent Mortgage that was taken out on this home.
Original Mortgage
$100,223
Outstanding Balance
$89,406
Interest Rate
4.75%
Mortgage Type
FHA
Estimated Equity
$85,122
Purchase Details
Closed on
Mar 30, 2006
Sold by
Abrams Ray C and Abrams Melva C
Bought by
Bajcar Justin J and Bajcar Erika J
Home Financials for this Owner
Home Financials are based on the most recent Mortgage that was taken out on this home.
Original Mortgage
$92,500
Interest Rate
10.2%
Mortgage Type
Purchase Money Mortgage
Purchase Details
Closed on
May 12, 2004
Sold by
Estate Of Clara M Abrams
Bought by
Abrams Ray C
Create a Home Valuation Report for This Property
The Home Valuation Report is an in-depth analysis detailing your home's value as well as a comparison with similar homes in the area
Home Values in the Area
Average Home Value in this Area
Purchase History
| Date | Buyer | Sale Price | Title Company |
|---|---|---|---|
| Gass Mishella N | $110,000 | None Available | |
| Bajcar Justin J | $92,500 | Bond & Associates Title Agen | |
| Abrams Ray C | -- | -- |
Source: Public Records
Mortgage History
| Date | Status | Borrower | Loan Amount |
|---|---|---|---|
| Open | Gass Mishella N | $100,223 | |
| Previous Owner | Bajcar Justin J | $92,500 |
Source: Public Records
Tax History Compared to Growth
Tax History
| Year | Tax Paid | Tax Assessment Tax Assessment Total Assessment is a certain percentage of the fair market value that is determined by local assessors to be the total taxable value of land and additions on the property. | Land | Improvement |
|---|---|---|---|---|
| 2025 | $2,308 | $45,564 | $16,692 | $28,872 |
| 2024 | $2,308 | $45,564 | $16,692 | $28,872 |
| 2023 | $2,308 | $45,564 | $16,692 | $28,872 |
| 2022 | $2,073 | $32,316 | $11,841 | $20,475 |
| 2021 | $2,080 | $32,316 | $11,841 | $20,475 |
| 2020 | $2,082 | $32,320 | $11,840 | $20,480 |
| 2019 | $2,230 | $31,610 | $9,690 | $21,920 |
| 2018 | $1,962 | $31,610 | $9,690 | $21,920 |
| 2017 | $1,922 | $31,610 | $9,690 | $21,920 |
| 2016 | $1,977 | $28,060 | $9,690 | $18,370 |
| 2015 | $1,922 | $28,060 | $9,690 | $18,370 |
| 2014 | $1,870 | $28,060 | $9,690 | $18,370 |
| 2013 | $1,865 | $28,110 | $9,690 | $18,420 |
Source: Public Records
Map
Nearby Homes
- 451 Yager Rd
- 6407 Southview Dr
- 5776 Harter Home Dr
- 899 Loway Dr
- 781 Leeman Dr
- 715 Highland Park Dr
- 6090 Manchester Rd Unit 6096
- 427 Center Rd
- 0 W Comet Rd Unit 5079117
- 1062 Stump Rd
- 7060 Manchester Rd
- 6387 Hampsher Rd
- 5892 Woodward Dr
- S/L 14,15 Shakes Hotel Dr
- 4944 Coleman Dr
- 6 Shrakes Hotel Dr
- 4 Shrakes Hotel Dr
- 7 Shrakes Hotel Dr
- 5 Shrakes Hotel Dr
- 3 Shrakes Hotel Dr