Estimated Value: $546,000 - $703,000
3
Beds
2
Baths
1,168
Sq Ft
$547/Sq Ft
Est. Value
About This Home
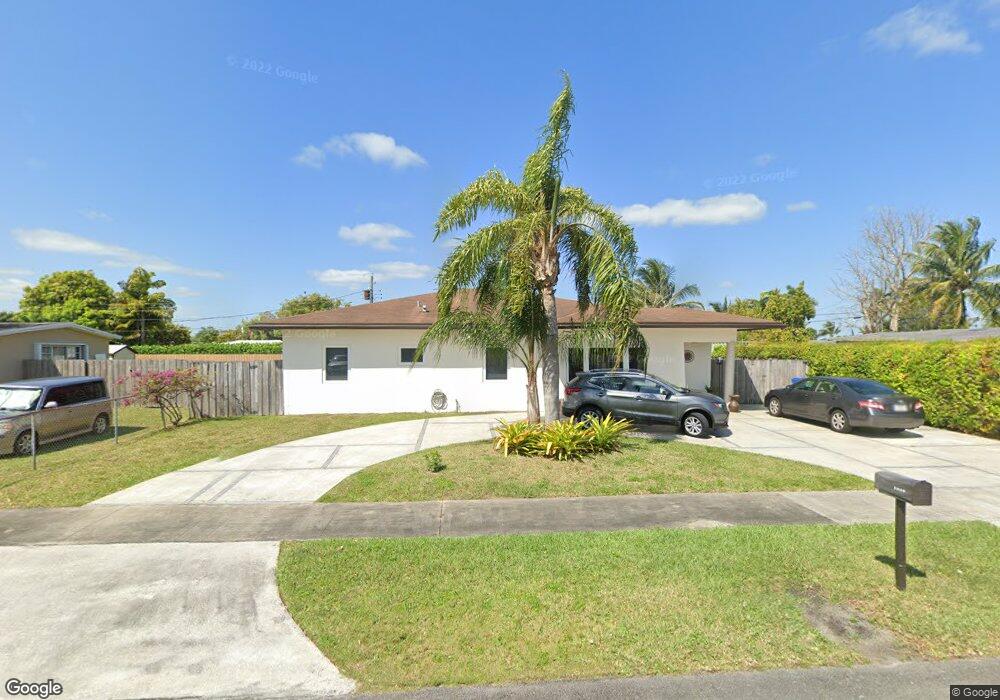
This home is located at 5820 SW 113th Ct, Miami, FL 33173 and is currently estimated at $639,077, approximately $547 per square foot. 5820 SW 113th Ct is a home located in Miami-Dade County with nearby schools including Cypress Elementary School, Riviera Middle School, and Southwest Miami Senior High School.
Ownership History
Date
Name
Owned For
Owner Type
Purchase Details
Closed on
Jun 14, 2018
Sold by
Omar Sicle
Bought by
Cisneros Marina and Sicle Omar Mauricio
Current Estimated Value
Purchase Details
Closed on
Sep 26, 2008
Sold by
Bank Of New York
Bought by
Sicle Omar and Cisneros Marina
Home Financials for this Owner
Home Financials are based on the most recent Mortgage that was taken out on this home.
Original Mortgage
$216,601
Outstanding Balance
$143,586
Interest Rate
6.45%
Mortgage Type
FHA
Estimated Equity
$495,491
Purchase Details
Closed on
Jun 13, 2008
Sold by
Serna Ascanio
Bought by
Bank Of New York
Purchase Details
Closed on
Oct 30, 2006
Sold by
Patterson Gwendolyn
Bought by
Serna Ascanio
Home Financials for this Owner
Home Financials are based on the most recent Mortgage that was taken out on this home.
Original Mortgage
$280,000
Interest Rate
7.47%
Mortgage Type
New Conventional
Create a Home Valuation Report for This Property
The Home Valuation Report is an in-depth analysis detailing your home's value as well as a comparison with similar homes in the area
Home Values in the Area
Average Home Value in this Area
Purchase History
| Date | Buyer | Sale Price | Title Company |
|---|---|---|---|
| Cisneros Marina | -- | None Available | |
| Sicle Omar | $220,000 | Landsafe Title Of Fl Inc | |
| Bank Of New York | $5,000 | None Available | |
| Serna Ascanio | $350,000 | Attorney |
Source: Public Records
Mortgage History
| Date | Status | Borrower | Loan Amount |
|---|---|---|---|
| Open | Sicle Omar | $216,601 | |
| Previous Owner | Serna Ascanio | $280,000 |
Source: Public Records
Tax History Compared to Growth
Tax History
| Year | Tax Paid | Tax Assessment Tax Assessment Total Assessment is a certain percentage of the fair market value that is determined by local assessors to be the total taxable value of land and additions on the property. | Land | Improvement |
|---|---|---|---|---|
| 2025 | $3,925 | $235,032 | -- | -- |
| 2024 | $3,683 | $228,409 | -- | -- |
| 2023 | $3,683 | $221,757 | $0 | $0 |
| 2022 | $3,540 | $215,299 | $0 | $0 |
| 2021 | $3,489 | $209,029 | $0 | $0 |
| 2020 | $3,450 | $206,143 | $0 | $0 |
| 2019 | $3,376 | $201,509 | $0 | $0 |
| 2018 | $3,225 | $197,752 | $0 | $0 |
| 2017 | $3,182 | $193,685 | $0 | $0 |
| 2016 | $3,155 | $189,702 | $0 | $0 |
| 2015 | $3,184 | $188,384 | $0 | $0 |
| 2014 | -- | $186,889 | $0 | $0 |
Source: Public Records
Map
Nearby Homes
- 11260 SW 60th Terrace
- 11350 SW 57th St
- 11500 SW 60th Terrace
- 5920 SW 116th Ave
- 6211 SW 116th Place Unit C22
- 6410 SW 112th Place
- 6421 SW 116th Ct Unit A
- 11389 SW 65th St
- 6415 SW 116th Place
- 5455 SW 116th Ave
- 11500 SW 64th St Unit H
- 6051 SW 110th Ave
- 5425 SW 112th Ave
- 6425 SW 116th Place Unit E
- 6445 SW 116th Place Unit A
- 6455 SW SW 116th Place Unit C
- 6666 SW 115th Ct Unit 406
- 6666 SW 115th Ct Unit 303
- 6604 SW 113th Ave
- 11070 SW 69th Dr
- 5900 SW 113th Ct
- 5810 SW 113th Ct
- 5825 SW 113th Place
- 5901 SW 113th Place
- 5920 SW 113th Place
- 5915 SW 113th Place
- 5910 SW 113th Ct
- 5800 SW 113th Ct
- 5825 SW 113th Ct
- 5901 SW 113th Ct
- 5950 NW 113th Place
- 5801 SW 113th Place
- 5915 SW 113th Ct
- 5920 SW 113th Ct
- 5801 SW 113th Ct
- 5925 SW 113th Place
- 11401 SW 59th Terrace
- 5820 SW 113th Ave
- 5925 SW 113th Ct
- 5810 SW 113th Ave