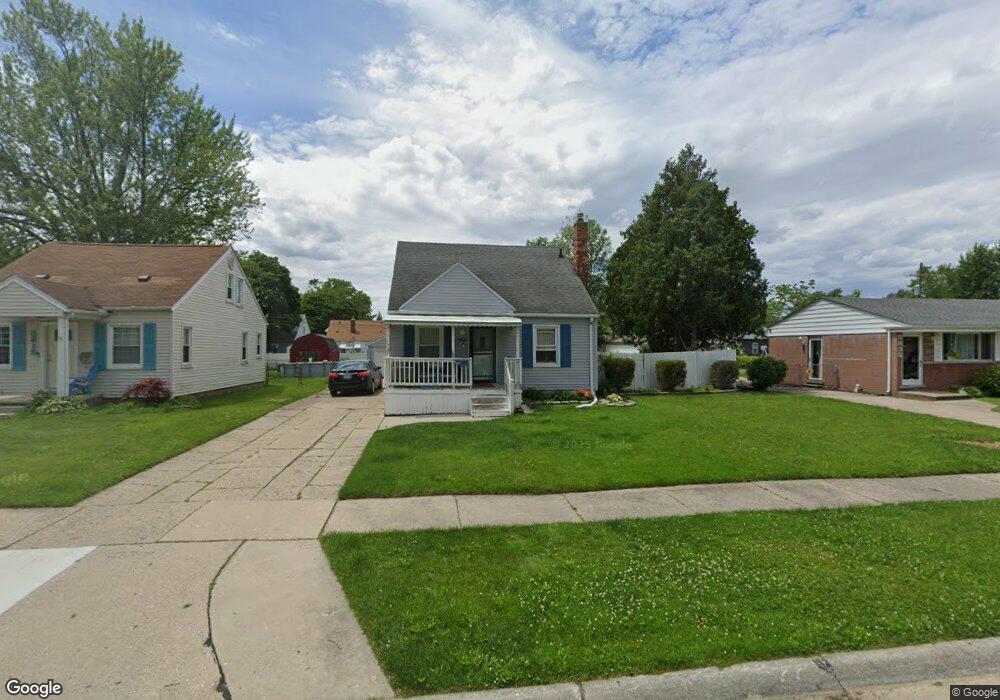
5821 Gilman St Unit Bldg-Unit Garden City, MI 48135
Estimated Value: $174,000 - $200,251
--
Bed
1
Bath
960
Sq Ft
$198/Sq Ft
Est. Value
About This Home
This home is located at 5821 Gilman St Unit Bldg-Unit, Garden City, MI 48135 and is currently estimated at $190,313, approximately $198 per square foot. 5821 Gilman St Unit Bldg-Unit is a home located in Wayne County with nearby schools including Douglas Elementary 3-4 Campus, Memorial Elementary 1-2 Campus, and Garden City Middle School.
Ownership History
Date
Name
Owned For
Owner Type
Purchase Details
Closed on
Mar 2, 2018
Sold by
Ronders Jason
Bought by
Ronders Jason
Current Estimated Value
Purchase Details
Closed on
Jun 27, 2017
Sold by
U S Bank N A
Bought by
Chiola Richard
Purchase Details
Closed on
Aug 16, 2016
Sold by
Spivey James E and Fretter Paul
Bought by
Us Bank and J P Morgan Mortrgage Acquisition Trust
Purchase Details
Closed on
Apr 13, 2006
Sold by
Fannie Mae
Bought by
Fretter Dawn
Purchase Details
Closed on
Mar 3, 2005
Sold by
Mortgage Electronic Registration Systems
Bought by
Federal National Mortgage Association
Purchase Details
Closed on
Mar 2, 2005
Sold by
Riggio Andrew
Bought by
Mortgage Electronic Registration Systems
Purchase Details
Closed on
Mar 17, 2003
Sold by
Hud
Bought by
Riggio Andrew
Purchase Details
Closed on
Jan 10, 2002
Sold by
Moses Jeffrey G
Bought by
North American Mtg Co
Create a Home Valuation Report for This Property
The Home Valuation Report is an in-depth analysis detailing your home's value as well as a comparison with similar homes in the area
Home Values in the Area
Average Home Value in this Area
Purchase History
| Date | Buyer | Sale Price | Title Company |
|---|---|---|---|
| Ronders Jason | -- | Fidelity National Title | |
| Hronders Jason | $115,000 | Fidelity National Title | |
| Chiola Richard | $67,501 | None Available | |
| Us Bank | $196,005 | None Available | |
| Fretter Dawn | $123,600 | Greco | |
| Federal National Mortgage Association | -- | -- | |
| Mortgage Electronic Registration Systems | $107,587 | -- | |
| Riggio Andrew | $108,000 | Minnesota Title Agency | |
| North American Mtg Co | $114,411 | -- |
Source: Public Records
Tax History Compared to Growth
Tax History
| Year | Tax Paid | Tax Assessment Tax Assessment Total Assessment is a certain percentage of the fair market value that is determined by local assessors to be the total taxable value of land and additions on the property. | Land | Improvement |
|---|---|---|---|---|
| 2025 | $3,723 | $84,400 | $0 | $0 |
| 2024 | $3,723 | $77,900 | $0 | $0 |
| 2023 | $3,635 | $66,700 | $0 | $0 |
| 2022 | $4,408 | $56,000 | $0 | $0 |
| 2021 | $3,818 | $53,400 | $0 | $0 |
| 2020 | $3,472 | $48,700 | $0 | $0 |
| 2019 | $2,577 | $41,700 | $0 | $0 |
| 2018 | $2,029 | $35,200 | $0 | $0 |
| 2017 | $966 | $33,100 | $0 | $0 |
| 2016 | $2,252 | $32,100 | $0 | $0 |
| 2015 | $2,753 | $29,900 | $0 | $0 |
| 2013 | $2,730 | $28,300 | $0 | $0 |
| 2012 | $1,690 | $29,400 | $8,700 | $20,700 |
Source: Public Records
Map
Nearby Homes
- 5851 Gilman St
- 5803 Deering St
- 5850 Deering St
- 6150 Gilman St
- 6169 Gilman St
- 28462 Birchlawn St
- 5706 Cardwell St
- 28424 Elmwood St
- 28538 Block St
- 6253 Lathers St
- 6326 Lathers St
- 28614 Block St
- 1782 Gilman St
- 116 Arcola St
- 28530 John Hauk St
- 6051 Arcola St
- 28343 Maplewood St
- 28832 Block St
- 1745 Cardwell St
- 28649 John Hauk St
- 5821 Gilman St
- 5821 Gilman St
- 5815 Gilman St
- 5835 Gilman St
- 5816 Gilman St
- 5757 Gilman St
- 5808 Gilman St
- 000 Birchlawn St
- 0 Birchlawn St
- 5822 Lathers St Unit Bldg-Unit
- 5822 Lathers St
- 5814 Lathers St
- 5836 Gilman St
- 5806 Lathers St
- 5749 Gilman St
- 5844 Gilman St
- 5756 Gilman St
- 5838 Lathers St
- 5852 Gilman St
- 5752 Lathers St