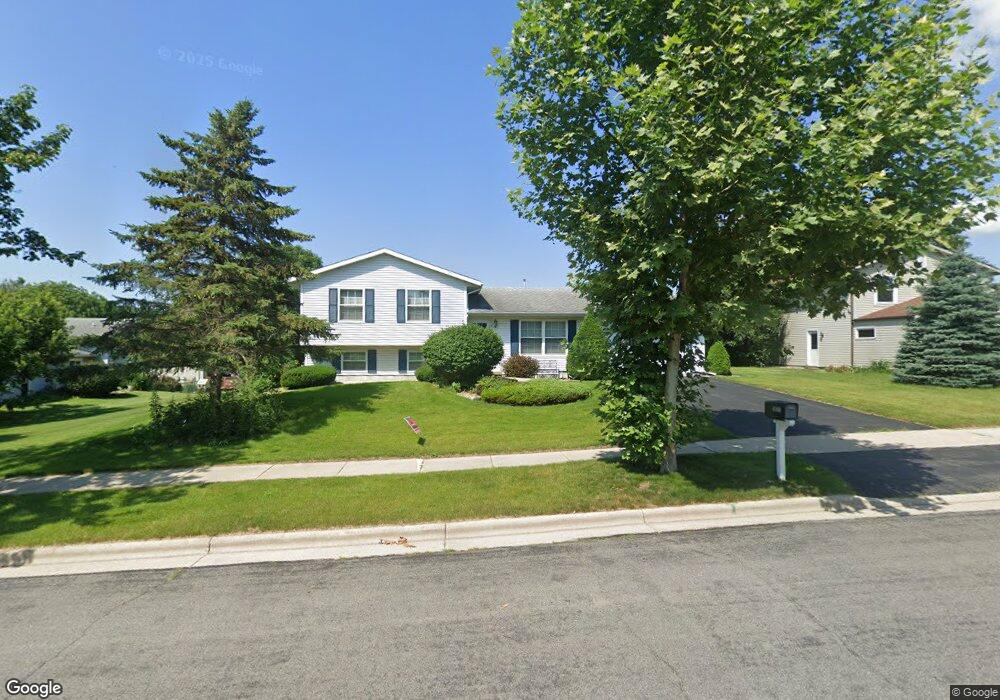
5821 Oxbow Bend Madison, WI 53716
East Buckeye NeighborhoodEstimated Value: $414,282 - $443,000
3
Beds
2
Baths
1,780
Sq Ft
$241/Sq Ft
Est. Value
About This Home
This home is located at 5821 Oxbow Bend, Madison, WI 53716 and is currently estimated at $429,321, approximately $241 per square foot. 5821 Oxbow Bend is a home located in Dane County with nearby schools including Elvehjem Elementary School, Sennett Middle School, and La Follette High School.
Ownership History
Date
Name
Owned For
Owner Type
Purchase Details
Closed on
Jul 5, 2017
Sold by
Riedel Clifford J and Riedel Claudia G
Bought by
Riedel Clifford John and Riedel Claudia Gay
Current Estimated Value
Purchase Details
Closed on
Sep 3, 2009
Sold by
Schwoegler Rodney S and Schwoegler Wendy B
Bought by
Riedel Clifford J and Riedel Claudia G
Home Financials for this Owner
Home Financials are based on the most recent Mortgage that was taken out on this home.
Original Mortgage
$90,600
Outstanding Balance
$58,066
Interest Rate
5.28%
Mortgage Type
New Conventional
Estimated Equity
$371,255
Purchase Details
Closed on
Feb 7, 2007
Sold by
Stratton Guy D and Stratton Krysia L
Bought by
Schwoegler Rodney S and Schwoegler Wendy B
Home Financials for this Owner
Home Financials are based on the most recent Mortgage that was taken out on this home.
Original Mortgage
$159,920
Interest Rate
6.22%
Mortgage Type
Purchase Money Mortgage
Create a Home Valuation Report for This Property
The Home Valuation Report is an in-depth analysis detailing your home's value as well as a comparison with similar homes in the area
Home Values in the Area
Average Home Value in this Area
Purchase History
| Date | Buyer | Sale Price | Title Company |
|---|---|---|---|
| Riedel Clifford John | -- | None Available | |
| Riedel Clifford J | $209,500 | Ticor Title Insurance Co | |
| Schwoegler Rodney S | $169,000 | None Available |
Source: Public Records
Mortgage History
| Date | Status | Borrower | Loan Amount |
|---|---|---|---|
| Open | Riedel Clifford J | $90,600 | |
| Previous Owner | Schwoegler Rodney S | $159,920 |
Source: Public Records
Tax History
| Year | Tax Paid | Tax Assessment Tax Assessment Total Assessment is a certain percentage of the fair market value that is determined by local assessors to be the total taxable value of land and additions on the property. | Land | Improvement |
|---|---|---|---|---|
| 2025 | $7,187 | $404,800 | $76,600 | $328,200 |
| 2024 | $12,997 | $387,000 | $76,600 | $310,400 |
| 2023 | $6,244 | $364,400 | $72,100 | $292,300 |
| 2022 | $12,031 | $321,900 | $63,700 | $258,200 |
| 2021 | $5,736 | $284,900 | $63,700 | $221,200 |
| 2020 | $5,546 | $259,000 | $57,900 | $201,100 |
| 2019 | $5,267 | $246,700 | $55,100 | $191,600 |
| 2018 | $5,128 | $239,500 | $55,100 | $184,400 |
| 2017 | $5,104 | $228,100 | $50,100 | $178,000 |
| 2016 | $4,881 | $213,200 | $50,100 | $163,100 |
| 2015 | $4,710 | $199,000 | $50,100 | $148,900 |
| 2014 | $4,612 | $199,000 | $50,100 | $148,900 |
| 2013 | $4,650 | $199,000 | $50,100 | $148,900 |
Source: Public Records
Map
Nearby Homes
- 5525 Forge Dr
- 10 Kings Mill Cir Unit 304
- 1606 Ellen Ave
- 1314 Manassas Trail
- 3602 Agriculture Dr
- 1907-1909 Dondee Rd
- 4706 Starker Ave
- 1002 Ellen Ave
- 1002 Severson Dr
- 4521 Deerwood Dr
- 6430 Maywick Dr Unit 6430
- 718 Orion Trail
- 1306 Acewood Blvd
- 4721 Femrite Dr
- 1133 Bonnie Ln
- 818 Herndon Dr Unit 2
- 617 Orion Trail
- 607 Malvern Hill Dr
- 705 Malvern Hill Dr
- 4713 Camden Rd
- 5817 Oxbow Bend
- 5833 Oxbow Bend
- 5729 Bellows Cir
- 5813 Oxbow Bend
- 5822 Oxbow Bend
- 5818 Oxbow Bend
- 5814 Oxbow Bend
- 5826 Oxbow Bend
- 5849 Oxbow Bend
- 5834 Oxbow Bend
- 5725 Bellows Cir
- 5722 Bellows Cir
- 5729 Blacksmith Ln
- 5723 Blacksmith Ln
- 5810 Oxbow Bend
- 5830 Oxbow Bend
- 5853 Oxbow Bend
- 5838 Oxbow Bend
- 5842 Oxbow Bend
- 5806 Oxbow Bend
Your Personal Tour Guide
Ask me questions while you tour the home.