Estimated Value: $333,000 - $388,000
4
Beds
2
Baths
1,450
Sq Ft
$250/Sq Ft
Est. Value
About This Home
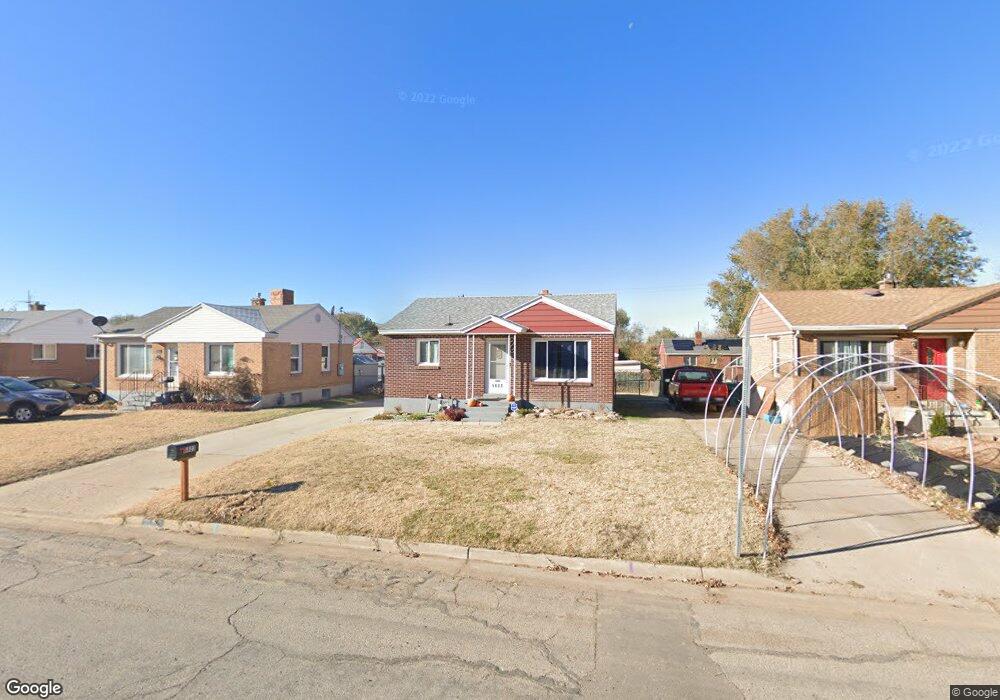
This home is located at 5823 S 2600 W, Roy, UT 84067 and is currently estimated at $362,774, approximately $250 per square foot. 5823 S 2600 W is a home located in Weber County with nearby schools including Roy Elementary School, Roy Junior High School, and Roy High School.
Ownership History
Date
Name
Owned For
Owner Type
Purchase Details
Closed on
Oct 21, 2021
Sold by
Grimes Dee Evan
Bought by
Marie Sparrow Samantha Amanda and Sparrow Ashton
Current Estimated Value
Home Financials for this Owner
Home Financials are based on the most recent Mortgage that was taken out on this home.
Original Mortgage
$310,650
Outstanding Balance
$283,284
Interest Rate
2.8%
Mortgage Type
New Conventional
Estimated Equity
$79,490
Purchase Details
Closed on
Mar 13, 2018
Sold by
Treehouyse Investmets Llc
Bought by
Grimes Dee Evan
Home Financials for this Owner
Home Financials are based on the most recent Mortgage that was taken out on this home.
Original Mortgage
$187,572
Interest Rate
4.22%
Mortgage Type
VA
Purchase Details
Closed on
Dec 8, 2017
Sold by
Heywood Harry L and Heywood Johnnie F
Bought by
Treehouse Investments Llc
Create a Home Valuation Report for This Property
The Home Valuation Report is an in-depth analysis detailing your home's value as well as a comparison with similar homes in the area
Home Values in the Area
Average Home Value in this Area
Purchase History
| Date | Buyer | Sale Price | Title Company |
|---|---|---|---|
| Marie Sparrow Samantha Amanda | -- | Us Title Insurance Agency | |
| Grimes Dee Evan | -- | Richland Title Ins Agency In | |
| Treehouse Investments Llc | -- | Richland Title Ins Agency In |
Source: Public Records
Mortgage History
| Date | Status | Borrower | Loan Amount |
|---|---|---|---|
| Open | Marie Sparrow Samantha Amanda | $310,650 | |
| Previous Owner | Grimes Dee Evan | $187,572 |
Source: Public Records
Tax History Compared to Growth
Tax History
| Year | Tax Paid | Tax Assessment Tax Assessment Total Assessment is a certain percentage of the fair market value that is determined by local assessors to be the total taxable value of land and additions on the property. | Land | Improvement |
|---|---|---|---|---|
| 2025 | $1,831 | $322,995 | $95,215 | $227,780 |
| 2024 | $1,767 | $172,699 | $52,376 | $120,323 |
| 2023 | $1,708 | $167,200 | $53,638 | $113,562 |
| 2022 | $1,941 | $193,600 | $49,858 | $143,742 |
| 2021 | $1,548 | $256,000 | $58,268 | $197,732 |
| 2020 | $1,367 | $207,000 | $58,268 | $148,732 |
| 2019 | $1,357 | $194,000 | $34,683 | $159,317 |
| 2018 | $962 | $130,000 | $30,008 | $99,992 |
| 2017 | $887 | $113,000 | $30,008 | $82,992 |
| 2016 | $866 | $59,455 | $17,228 | $42,227 |
| 2015 | $780 | $55,179 | $19,813 | $35,366 |
| 2014 | $705 | $49,348 | $14,630 | $34,718 |
Source: Public Records
Map
Nearby Homes
- 2587 W 5750 S
- 2571 W 5725 S
- 2672 W 5750 S
- 5810 S 2550 W
- 2646 W 5625 S Unit M-2646
- 2829 W 5925 S
- 2907 W 5775 S
- 2778 W 5550 S Unit 28
- 484 W 2650 N
- 480 W 2650 N
- 2635 N 500 W Unit 45
- 5643 S 2200 W
- 2612 N 525 W
- 2593 N 500 W Unit 56
- 2602 N 2125 W
- 2486 N 690 W
- 428 W 2650 N
- 3009 W 6000 S
- 2537 N 1220 W
- 2382 N 770 W