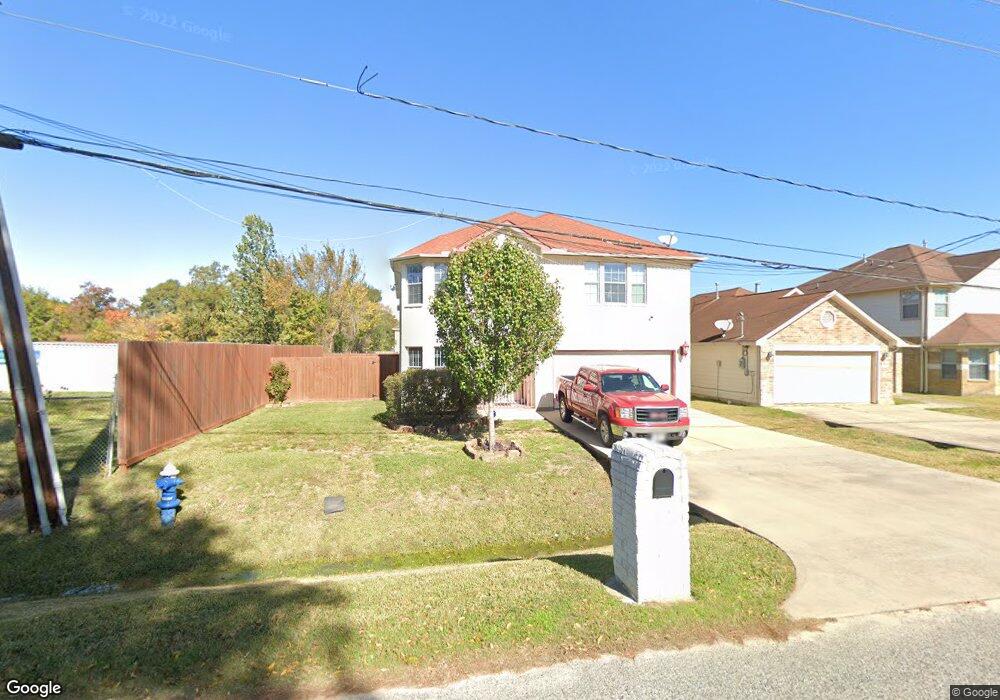
5823 Tautenhahn Rd Houston, TX 77016
East Little York NeighborhoodEstimated Value: $278,000 - $345,000
4
Beds
3
Baths
3,112
Sq Ft
$97/Sq Ft
Est. Value
About This Home
This home is located at 5823 Tautenhahn Rd, Houston, TX 77016 and is currently estimated at $302,424, approximately $97 per square foot. 5823 Tautenhahn Rd is a home located in Harris County with nearby schools including Shadydale Elementary School, Forest Brook Middle, and North Forest High School.
Ownership History
Date
Name
Owned For
Owner Type
Purchase Details
Closed on
Jul 31, 2010
Sold by
Washington Thomas J
Bought by
Jones Washington Elsie
Current Estimated Value
Purchase Details
Closed on
Jul 26, 2006
Sold by
Burghli Investments Llc
Bought by
Washington Thomas J
Home Financials for this Owner
Home Financials are based on the most recent Mortgage that was taken out on this home.
Original Mortgage
$38,000
Interest Rate
6.78%
Mortgage Type
Stand Alone Second
Purchase Details
Closed on
Mar 29, 2006
Sold by
Royal Oak Enterprises Llc
Bought by
Burghli Investments Llc
Home Financials for this Owner
Home Financials are based on the most recent Mortgage that was taken out on this home.
Original Mortgage
$150,204
Interest Rate
6.24%
Mortgage Type
Purchase Money Mortgage
Create a Home Valuation Report for This Property
The Home Valuation Report is an in-depth analysis detailing your home's value as well as a comparison with similar homes in the area
Home Values in the Area
Average Home Value in this Area
Purchase History
| Date | Buyer | Sale Price | Title Company |
|---|---|---|---|
| Jones Washington Elsie | -- | None Available | |
| Washington Thomas J | -- | Stewart Title Houston Div | |
| Burghli Investments Llc | -- | Stewart Title Houston Div |
Source: Public Records
Mortgage History
| Date | Status | Borrower | Loan Amount |
|---|---|---|---|
| Previous Owner | Washington Thomas J | $38,000 | |
| Previous Owner | Washington Thomas J | $152,000 | |
| Previous Owner | Burghli Investments Llc | $150,204 |
Source: Public Records
Tax History Compared to Growth
Tax History
| Year | Tax Paid | Tax Assessment Tax Assessment Total Assessment is a certain percentage of the fair market value that is determined by local assessors to be the total taxable value of land and additions on the property. | Land | Improvement |
|---|---|---|---|---|
| 2025 | $979 | $328,231 | $47,165 | $281,066 |
| 2024 | $979 | $320,613 | $36,789 | $283,824 |
| 2023 | $979 | $320,613 | $36,789 | $283,824 |
| 2022 | $4,952 | $258,644 | $28,299 | $230,345 |
| 2021 | $4,765 | $218,716 | $28,299 | $190,417 |
| 2020 | $4,501 | $189,639 | $14,150 | $175,489 |
| 2019 | $4,276 | $188,260 | $14,150 | $174,110 |
| 2018 | $1,019 | $153,618 | $14,150 | $139,468 |
| 2017 | $3,740 | $153,618 | $14,150 | $139,468 |
| 2016 | $3,400 | $134,478 | $14,150 | $120,328 |
| 2015 | $1,136 | $134,478 | $14,150 | $120,328 |
| 2014 | $1,136 | $134,478 | $14,150 | $120,328 |
Source: Public Records
Map
Nearby Homes
- 10821 Seneca St
- 10507 Vinca Minor Ln
- 5815 Mohawk St
- 5833 Mohawk St
- 0 Cedar Hill Ln Unit 45497108
- 5611 Yorkwood St
- 5905 Langley Rd
- 10606 Bucknell Rd
- 0 Hopper Rd Unit 35613143
- 6315 Mardale Dr
- 10538 Royal Oaks Dr
- 5618 Briarwick Ln
- 10535 Hollyglen Dr
- 10526 Hollyglen Dr
- 6302 Hanley Ln
- 10403 Meadow Saffron Dr
- 10711 Red Orchid Dr
- 6414 Mohawk St
- 6319 Hopper Rd
- 0 Cheeves Dr Unit 62643937
- 5827 Tautenhahn Rd
- 5831 Tautenhahn Rd
- 5835 Tautenhahn Rd
- 5802 Darlington Oak St
- 5839 Tautenhahn Rd
- 10915 Myrtle Oak St
- 5816 Tautenhahn Rd
- 5818 Tautenhahn Rd
- 5806 Darlington Oak St
- 5807 Tautenhahn Rd
- 5843 Tautenhahn Rd
- 5810 Darlington Oak St
- 10910 Maple Leaf St
- 10910 Maple Leaf St Unit B
- 10919 Myrtle Oak St
- 5803 Darlington Oak St
- 5814 Darlington Oak St
- 5847 Tautenhahn Rd
- 5807 Darlington Oak St
- 10923 Myrtle Oak St