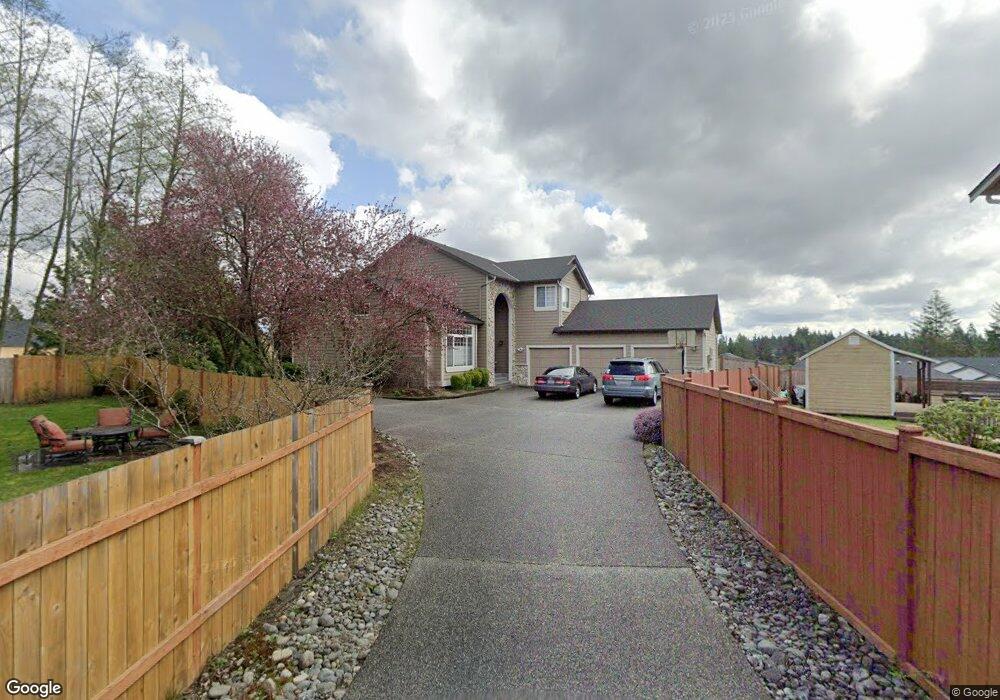
5824 159th St SW Edmonds, WA 98026
Estimated Value: $941,000 - $1,052,000
3
Beds
3
Baths
2,292
Sq Ft
$442/Sq Ft
Est. Value
About This Home
This home is located at 5824 159th St SW, Edmonds, WA 98026 and is currently estimated at $1,013,408, approximately $442 per square foot. 5824 159th St SW is a home located in Snohomish County with nearby schools including Beverly Elementary School, Meadowdale Middle School, and Meadowdale High School.
Ownership History
Date
Name
Owned For
Owner Type
Purchase Details
Closed on
Feb 8, 2012
Sold by
Johnson Polly Becker
Bought by
Johnson Martin E
Current Estimated Value
Purchase Details
Closed on
Dec 9, 1999
Sold by
Butler Leola E and Butler Namon L
Bought by
Johnson Martin E and Johnson Polly Becker
Home Financials for this Owner
Home Financials are based on the most recent Mortgage that was taken out on this home.
Original Mortgage
$236,000
Outstanding Balance
$71,663
Interest Rate
7.68%
Estimated Equity
$941,745
Purchase Details
Closed on
Jul 29, 1997
Sold by
Almark Corp
Bought by
Butler Leola E and Butler Namon L
Home Financials for this Owner
Home Financials are based on the most recent Mortgage that was taken out on this home.
Original Mortgage
$209,655
Interest Rate
9.75%
Create a Home Valuation Report for This Property
The Home Valuation Report is an in-depth analysis detailing your home's value as well as a comparison with similar homes in the area
Home Values in the Area
Average Home Value in this Area
Purchase History
| Date | Buyer | Sale Price | Title Company |
|---|---|---|---|
| Johnson Martin E | -- | None Available | |
| Johnson Martin E | $295,000 | -- | |
| Butler Leola E | $232,950 | -- |
Source: Public Records
Mortgage History
| Date | Status | Borrower | Loan Amount |
|---|---|---|---|
| Open | Johnson Martin E | $236,000 | |
| Previous Owner | Butler Leola E | $209,655 |
Source: Public Records
Tax History Compared to Growth
Tax History
| Year | Tax Paid | Tax Assessment Tax Assessment Total Assessment is a certain percentage of the fair market value that is determined by local assessors to be the total taxable value of land and additions on the property. | Land | Improvement |
|---|---|---|---|---|
| 2025 | $6,855 | $830,100 | $480,000 | $350,100 |
| 2024 | $6,786 | $819,100 | $469,000 | $350,100 |
| 2023 | $5,797 | $726,500 | $322,000 | $404,500 |
| 2022 | $6,477 | $665,300 | $322,000 | $343,300 |
| 2020 | $6,270 | $569,300 | $273,000 | $296,300 |
| 2019 | $6,186 | $559,400 | $266,000 | $293,400 |
| 2018 | $6,245 | $497,800 | $236,000 | $261,800 |
| 2017 | $5,418 | $447,000 | $200,000 | $247,000 |
| 2016 | $4,998 | $413,600 | $177,000 | $236,600 |
| 2015 | $4,741 | $372,400 | $150,000 | $222,400 |
| 2013 | $4,478 | $334,400 | $128,000 | $206,400 |
Source: Public Records
Map
Nearby Homes
- 5921 160th St SW
- 5727 160th St SW
- 5725 160th St SW
- 5728 160th St SW
- 5714 160th St SW
- 5712 160th St SW
- Indigo Plan at Edmonds Ridge
- Lotus Plan at Edmonds Ridge
- Spirea Plan at Edmonds Ridge
- Verbena Plan at Edmonds Ridge
- Azalea Plan at Edmonds Ridge
- Ivy Plan at Edmonds Ridge
- 5719 160th St SW
- 16027 57th Ave W
- 16033 57th Ave W
- 5724 161st St SW
- 5411 158th Place SW
- 5404 158th Place SW
- 5921 164th St SW
- 16410 60th Ave W
- 5820 159th St SW
- 5828 159th St SW
- 5816 159th St SW
- 15921 60th Ave W
- 15910 56th Ave W
- 5728 159th St SW
- 5812 159th St SW
- 5833 159th St SW
- 5720 159th St SW
- 5808 159th St SW
- 5811 159th St SW
- 5710 159th St SW
- 5804 159th St SW
- 5718 158th St SW
- 5805 159th St SW
- 5725 158th St SW
- 15803 60th Ave W
- 5802 159th St SW
- 5703 160th St SW
- 16101 60th Ave W