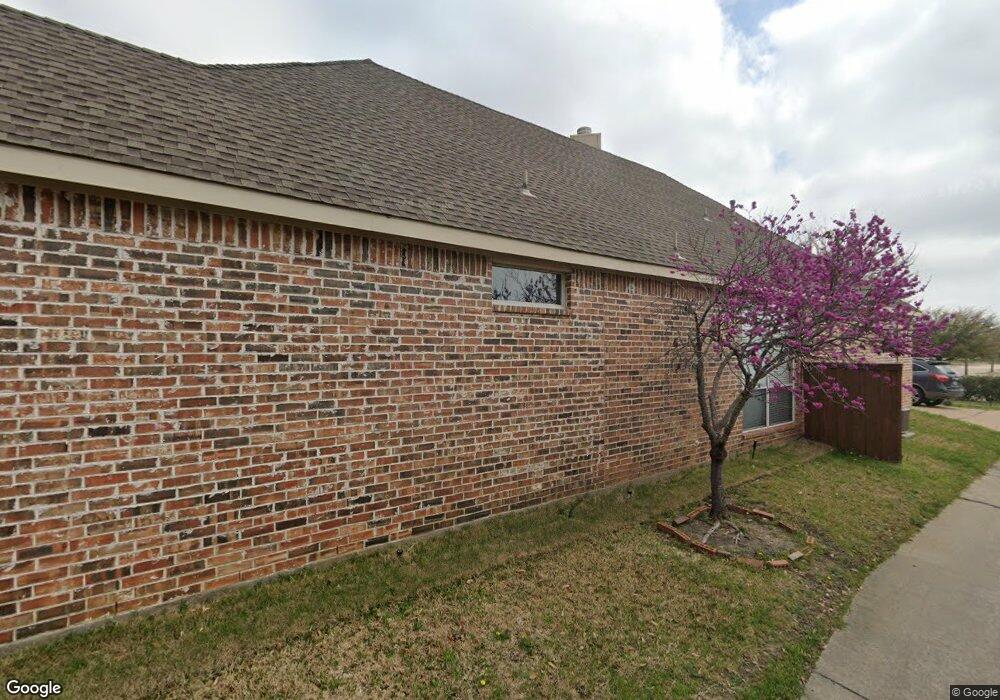
5824 Pepperridge Dr Richardson, TX 75082
Breckinridge NeighborhoodEstimated Value: $554,000 - $596,000
3
Beds
3
Baths
2,890
Sq Ft
$198/Sq Ft
Est. Value
About This Home
This home is located at 5824 Pepperridge Dr, Richardson, TX 75082 and is currently estimated at $572,791, approximately $198 per square foot. 5824 Pepperridge Dr is a home located in Collin County with nearby schools including Firewheel Christian Academy and Oakhill Day School.
Ownership History
Date
Name
Owned For
Owner Type
Purchase Details
Closed on
Jul 15, 2020
Sold by
Layrisse Manuel
Bought by
Mclemore Pamela Jean and Mclemore Kirk Darren
Current Estimated Value
Home Financials for this Owner
Home Financials are based on the most recent Mortgage that was taken out on this home.
Original Mortgage
$225,000
Outstanding Balance
$179,482
Interest Rate
3.1%
Mortgage Type
New Conventional
Estimated Equity
$393,309
Purchase Details
Closed on
Dec 2, 2003
Sold by
Hall Jack and Suzanne Hall M
Bought by
Layrisse Manuel
Home Financials for this Owner
Home Financials are based on the most recent Mortgage that was taken out on this home.
Original Mortgage
$209,600
Interest Rate
6.01%
Mortgage Type
Purchase Money Mortgage
Purchase Details
Closed on
Aug 28, 2001
Sold by
Drees Custom Homes Lp
Bought by
Hall Jack
Home Financials for this Owner
Home Financials are based on the most recent Mortgage that was taken out on this home.
Original Mortgage
$214,700
Interest Rate
6.98%
Create a Home Valuation Report for This Property
The Home Valuation Report is an in-depth analysis detailing your home's value as well as a comparison with similar homes in the area
Home Values in the Area
Average Home Value in this Area
Purchase History
| Date | Buyer | Sale Price | Title Company |
|---|---|---|---|
| Mclemore Pamela Jean | -- | Texas Premier Title | |
| Layrisse Manuel | -- | -- | |
| Hall Jack | -- | -- |
Source: Public Records
Mortgage History
| Date | Status | Borrower | Loan Amount |
|---|---|---|---|
| Open | Mclemore Pamela Jean | $225,000 | |
| Previous Owner | Layrisse Manuel | $209,600 | |
| Previous Owner | Hall Jack | $214,700 |
Source: Public Records
Tax History Compared to Growth
Tax History
| Year | Tax Paid | Tax Assessment Tax Assessment Total Assessment is a certain percentage of the fair market value that is determined by local assessors to be the total taxable value of land and additions on the property. | Land | Improvement |
|---|---|---|---|---|
| 2025 | $7,456 | $523,046 | $152,000 | $396,334 |
| 2024 | $7,456 | $475,496 | $152,000 | $408,728 |
| 2023 | $7,456 | $432,269 | $142,500 | $390,500 |
| 2022 | $7,524 | $392,972 | $142,500 | $387,788 |
| 2021 | $7,442 | $357,247 | $104,500 | $252,747 |
| 2020 | $7,776 | $350,481 | $104,500 | $245,981 |
| 2019 | $8,492 | $365,078 | $104,500 | $260,578 |
| 2018 | $8,603 | $368,227 | $95,000 | $273,227 |
| 2017 | $8,018 | $343,217 | $76,000 | $267,217 |
| 2016 | $7,605 | $323,084 | $76,000 | $247,084 |
| 2015 | $6,408 | $294,751 | $76,000 | $218,751 |
Source: Public Records
Map
Nearby Homes
- 2720 Ranchview Dr
- 18 Kilchurn
- 1201 Tralee Ln
- 1230 Donegal Ln
- 1001 Lochness Ln
- 2988 Hillingdon Dr
- 1526 Bonanza Ct
- 7010 Cottonwood Cir
- 7022 Cottonwood Cir
- 2006 Cori Place
- 6905 Wilhelmina Dr
- 2011 Cori Place
- 3041 Hillingdon Dr
- 403 Pleasant Run
- 2525 E Brand Rd
- 3203 Grantham Dr
- 5517 Enfield Dr
- 179 Moonlight Dr
- 2004 Bonanza Dr
- 7307 Crane Dr
- 5820 Pepperridge Dr
- 5828 Pepperridge Dr
- 5816 Pepperridge Dr
- 2600 Ranchview Dr
- 2601 Ranchview Dr
- 2604 Ranchview Dr
- 5812 Pepperridge Dr
- 2600 Fairfield Dr
- 2605 Ranchview Dr
- 2608 Ranchview Dr
- 5808 Pepperridge Dr
- 2609 Ranchview Dr
- 2612 Ranchview Dr
- 2608 Fairfield Dr
- 5804 Pepperridge Dr
- 6905 Westside Place
- 2601 Fairfield Dr
- 2613 Ranchview Dr
- 6909 Westside Place
- 2612 Fairfield Dr