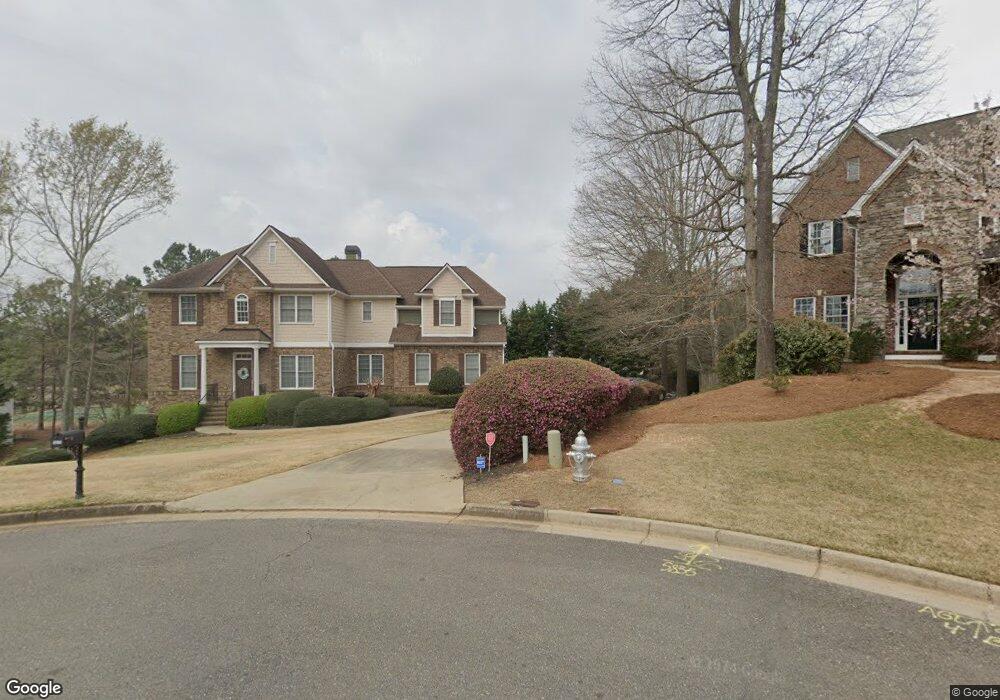
5825 Aspen Forest Ct Cumming, GA 30040
Estimated Value: $771,916 - $845,000
5
Beds
5
Baths
3,126
Sq Ft
$254/Sq Ft
Est. Value
About This Home
This home is located at 5825 Aspen Forest Ct, Cumming, GA 30040 and is currently estimated at $792,979, approximately $253 per square foot. 5825 Aspen Forest Ct is a home located in Forsyth County with nearby schools including Matt Elementary School, Liberty Middle School, and North Forsyth High School.
Ownership History
Date
Name
Owned For
Owner Type
Purchase Details
Closed on
Jun 10, 2025
Sold by
Drake Harold Arthur and Drake Yolanda May
Bought by
H Y Drake Trust and Drake
Current Estimated Value
Purchase Details
Closed on
May 27, 2015
Sold by
Allen David Lee
Bought by
Drake Harold Arthur and Drake Yolanda May Cheng
Home Financials for this Owner
Home Financials are based on the most recent Mortgage that was taken out on this home.
Original Mortgage
$287,800
Interest Rate
3.79%
Mortgage Type
VA
Purchase Details
Closed on
Oct 29, 2002
Sold by
Weekley Homes Lp
Bought by
Allen David L and Allen Pamela R
Home Financials for this Owner
Home Financials are based on the most recent Mortgage that was taken out on this home.
Original Mortgage
$287,200
Interest Rate
5.95%
Mortgage Type
New Conventional
Purchase Details
Closed on
Nov 13, 2001
Sold by
Pathway Forsyth I
Bought by
Weekley Homes Lp
Create a Home Valuation Report for This Property
The Home Valuation Report is an in-depth analysis detailing your home's value as well as a comparison with similar homes in the area
Home Values in the Area
Average Home Value in this Area
Purchase History
| Date | Buyer | Sale Price | Title Company |
|---|---|---|---|
| H Y Drake Trust | -- | None Listed On Document | |
| Drake Harold Arthur | $400,000 | -- | |
| Allen David L | $359,000 | -- | |
| Weekley Homes Lp | $1,375,000 | -- |
Source: Public Records
Mortgage History
| Date | Status | Borrower | Loan Amount |
|---|---|---|---|
| Previous Owner | Drake Harold Arthur | $287,800 | |
| Previous Owner | Allen David L | $287,200 |
Source: Public Records
Tax History Compared to Growth
Tax History
| Year | Tax Paid | Tax Assessment Tax Assessment Total Assessment is a certain percentage of the fair market value that is determined by local assessors to be the total taxable value of land and additions on the property. | Land | Improvement |
|---|---|---|---|---|
| 2025 | $5,555 | $269,288 | $40,000 | $229,288 |
| 2024 | $5,555 | $267,576 | $40,000 | $227,576 |
| 2023 | $4,840 | $245,888 | $30,000 | $215,888 |
| 2022 | $5,055 | $164,692 | $24,000 | $140,692 |
| 2021 | $4,298 | $164,692 | $24,000 | $140,692 |
| 2020 | $4,141 | $157,084 | $24,000 | $133,084 |
| 2019 | $4,083 | $153,996 | $22,000 | $131,996 |
| 2018 | $3,895 | $144,708 | $22,000 | $122,708 |
| 2017 | $3,847 | $141,756 | $22,000 | $119,756 |
| 2016 | $3,934 | $141,756 | $22,000 | $119,756 |
| 2015 | $3,785 | $141,116 | $22,000 | $119,116 |
| 2014 | $3,377 | $130,860 | $22,000 | $108,860 |
Source: Public Records
Map
Nearby Homes
- 5925 Water Mark Dr
- 6040 Boulder Bluff Dr
- 6435 Lakeaires Dr
- 5315 Hendrix Rd
- 7480 Ivy Grove St
- 6445 Crystal Ln
- 7005 Walnut Mill Landing
- 7620 Ivy Grove St
- 6230 Dana Way
- 3940 Twin Lakes Rd
- 7085 Shady Oak Ln
- 4830 John Burruss Rd
- 5855 Willis Ln
- 5095 Karr Rd
- 4905 Rosarian Dr
- 4855 Rosarian Dr
- 4710 Rosarian Dr
- 5835 Aspen Forest Ct
- 5715 Lake Oak Landing
- 5815 Aspen Forest Ct
- 5830 Aspen Forest Ct
- 0 Aspen Forest Ct Unit 8321913
- 0 Aspen Forest Ct Unit 7290991
- 0 Aspen Forest Ct Unit 7358690
- 0 Aspen Forest Ct
- 5815 Lake Oak Landing
- 5575 Lake Oak Landing
- 5825 Lake Oak Landing
- 5675 Hendrix Rd Unit /21
- 5675 Hendrix Rd
- 5705 Broadwater Trail
- 5685 Hendrix Rd
- 5730 Lake Oak Landing
- 5740 Lake Oak Landing
- 5810 Lake Oak Landing
- 5750 Lake Oak Landing
- 5715 Broadwater Trail