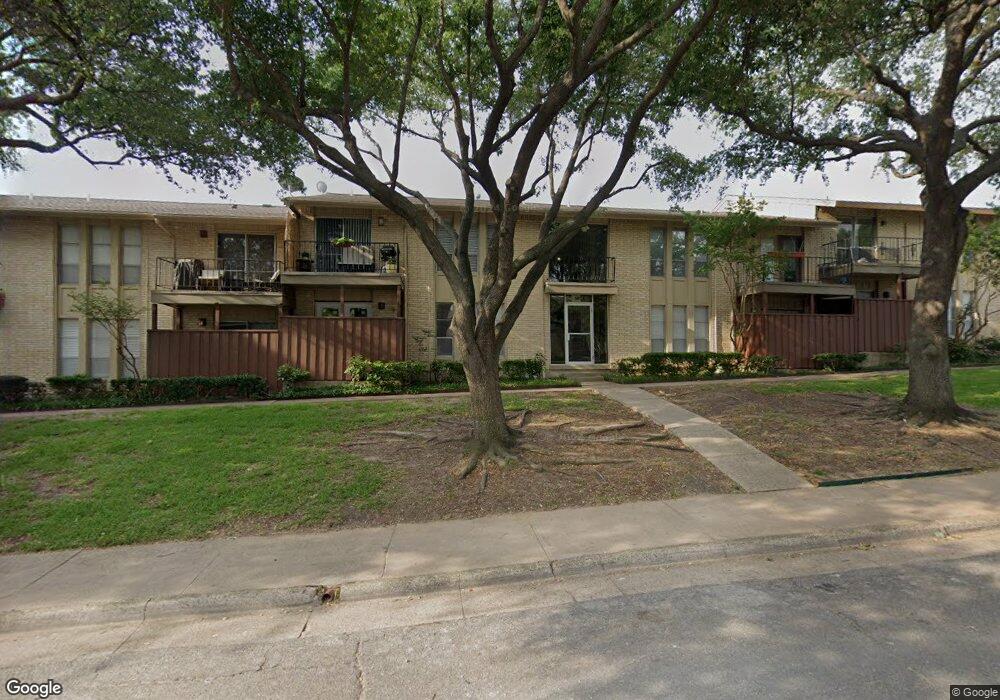
5826 Sandhurst Ln Unit A Dallas, TX 75206
Northeast Dallas NeighborhoodEstimated Value: $220,215 - $254,000
2
Beds
2
Baths
997
Sq Ft
$241/Sq Ft
Est. Value
About This Home
This home is located at 5826 Sandhurst Ln Unit A, Dallas, TX 75206 and is currently estimated at $240,304, approximately $241 per square foot. 5826 Sandhurst Ln Unit A is a home located in Dallas County with nearby schools including Mockingbird Elementary School, J L Long Middle School, and Woodrow Wilson High School.
Ownership History
Date
Name
Owned For
Owner Type
Purchase Details
Closed on
Oct 15, 2020
Sold by
Pluss Nohemi B
Bought by
Noguez Edgar Abel
Current Estimated Value
Purchase Details
Closed on
Oct 14, 2020
Sold by
Pluss Nohemi B
Bought by
Noguez Edgar Abel
Purchase Details
Closed on
Nov 7, 2018
Sold by
Pluss David M
Bought by
Pluss Nohemi B
Home Financials for this Owner
Home Financials are based on the most recent Mortgage that was taken out on this home.
Original Mortgage
$88,000
Interest Rate
4.9%
Mortgage Type
New Conventional
Purchase Details
Closed on
Mar 31, 2010
Sold by
Heald Gary R
Bought by
Pluss Nohemi B and Pluss David
Home Financials for this Owner
Home Financials are based on the most recent Mortgage that was taken out on this home.
Original Mortgage
$88,000
Interest Rate
5%
Mortgage Type
New Conventional
Purchase Details
Closed on
Aug 10, 2005
Sold by
Bistrain Emanuel and Bistrain Bianca Raluca
Bought by
Heald Gary R
Create a Home Valuation Report for This Property
The Home Valuation Report is an in-depth analysis detailing your home's value as well as a comparison with similar homes in the area
Home Values in the Area
Average Home Value in this Area
Purchase History
| Date | Buyer | Sale Price | Title Company |
|---|---|---|---|
| Noguez Edgar Abel | -- | None Available | |
| Noguez Edgar Abel | -- | None Listed On Document | |
| Noguez Edgar Abel | -- | None Listed On Document | |
| Pluss Nohemi B | -- | None Available | |
| Pluss Nohemi B | -- | Rtt | |
| Heald Gary R | -- | Ctic |
Source: Public Records
Mortgage History
| Date | Status | Borrower | Loan Amount |
|---|---|---|---|
| Previous Owner | Pluss Nohemi B | $88,000 | |
| Previous Owner | Pluss Nohemi B | $88,000 |
Source: Public Records
Tax History Compared to Growth
Tax History
| Year | Tax Paid | Tax Assessment Tax Assessment Total Assessment is a certain percentage of the fair market value that is determined by local assessors to be the total taxable value of land and additions on the property. | Land | Improvement |
|---|---|---|---|---|
| 2025 | $5,794 | $259,220 | $77,160 | $182,060 |
| 2024 | $5,794 | $259,220 | $77,160 | $182,060 |
| 2023 | $5,794 | $250,000 | $77,160 | $172,840 |
| 2022 | $2,179 | $87,160 | $77,160 | $10,000 |
| 2021 | $3,945 | $149,550 | $57,870 | $91,680 |
| 2020 | $4,057 | $149,550 | $57,870 | $91,680 |
| 2019 | $3,971 | $139,580 | $57,870 | $81,710 |
| 2018 | $3,795 | $139,580 | $57,870 | $81,710 |
| 2017 | $3,253 | $119,640 | $57,870 | $61,770 |
| 2016 | $2,928 | $107,680 | $38,580 | $69,100 |
| 2015 | $2,899 | $105,680 | $38,580 | $67,100 |
| 2014 | $2,899 | $105,680 | $38,580 | $67,100 |
Source: Public Records
Map
Nearby Homes
- 5820 Sandhurst Ln Unit D
- 4676 Matilda St Unit C
- 5844 Sandhurst Ln Unit D
- 5811 Sandhurst Ln Unit A
- 5818 E University Blvd Unit 236
- 5818 E University Blvd Unit 101
- 5818 E University Blvd Unit 138
- 5818 E University Blvd Unit 223
- 5818 E University Blvd Unit 123H
- 5908 Sandhurst Ln Unit 142
- 5934 Sandhurst Ln Unit 109
- 5908 Sandhurst Ln Unit 244
- 5934 Sandhurst Ln Unit 207
- 5919 E University Blvd Unit 236
- 5816 Birchbrook Dr Unit 118
- 5816 Birchbrook Dr Unit 124
- 5816 Birchbrook Dr Unit 122
- 5816 Birchbrook Dr Unit 214
- 5927 E University Blvd Unit 221
- 5907 E University Blvd Unit 201
- 4652 Matilda St Unit A
- 4524 Amesbury Dr Unit C
- 5856 Sandhurst Ln Unit A
- 4658 Matilda St Unit E
- 5844 Sandhurst Ln Unit A
- 4518 Amesbury Dr Unit B
- 4652 Matilda St Unit G
- 4652 Matilda St Unit C
- 4676 Matilda St Unit D
- 5814 Sandhurst Ln Unit B
- 5856F Sandhurst Ln Unit C
- 5856F Sandhurst Ln Unit A
- 4652 Matilda St Unit B
- 4664 Matilda St Unit D
- 4682 Matilda St Unit G
- 5808 Sandhurst Ln Unit B
- 4518 Amesbury Dr Unit A
- 5856F Sandhurst Ln Unit B
- 5856F Sandhurst Ln Unit D
- 5850F Sandhurst Ln Unit D