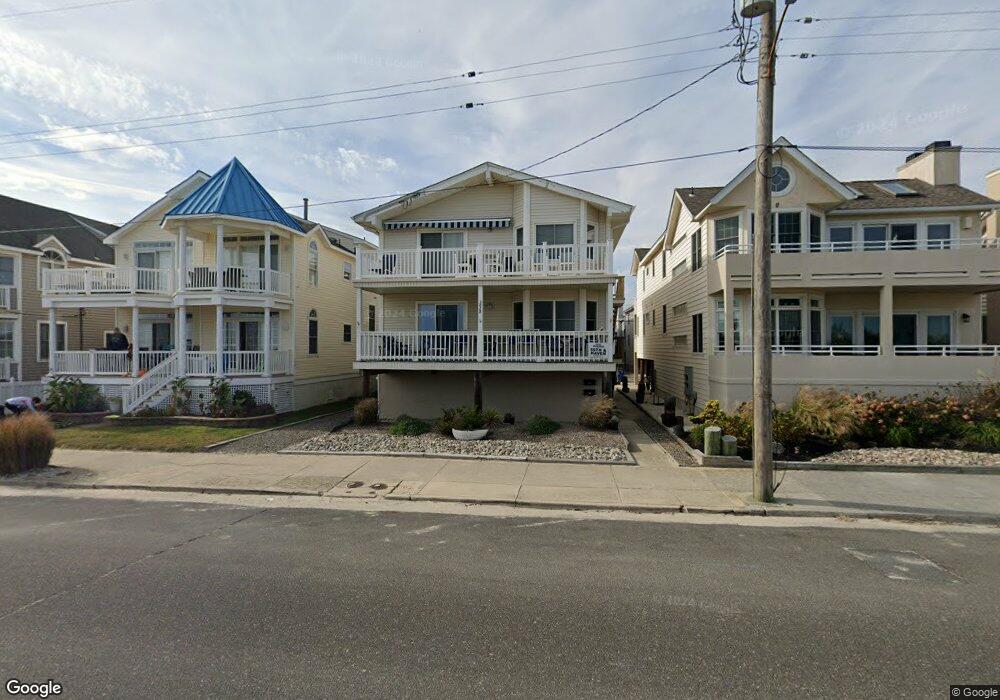
5828 Central Ave Unit 30 Ocean City, NJ 08226
Estimated Value: $1,138,903 - $2,103,000
--
Bed
--
Bath
1,390
Sq Ft
$1,119/Sq Ft
Est. Value
About This Home
This home is located at 5828 Central Ave Unit 30, Ocean City, NJ 08226 and is currently estimated at $1,555,476, approximately $1,119 per square foot. 5828 Central Ave Unit 30 is a home located in Cape May County with nearby schools including Ocean City Primary School, Ocean City Intermediate School, and Ocean City High School.
Ownership History
Date
Name
Owned For
Owner Type
Purchase Details
Closed on
Mar 18, 2025
Sold by
Lee Randolph M
Bought by
Lee Richard S and Lee Betsy S
Current Estimated Value
Purchase Details
Closed on
Aug 3, 2012
Sold by
Lee Tracy B
Bought by
Lee Randolph M
Purchase Details
Closed on
Feb 12, 2002
Sold by
Onimus Frank S
Bought by
Lee Randolph M and Lee Tracy B
Home Financials for this Owner
Home Financials are based on the most recent Mortgage that was taken out on this home.
Original Mortgage
$300,000
Interest Rate
7.01%
Purchase Details
Closed on
Dec 24, 1990
Sold by
Mattes Ronald A and Mattes Susan
Bought by
Onimus Frank S and Onimus Linda A
Purchase Details
Closed on
Mar 15, 1989
Sold by
Bradley Carlos
Bought by
Mattes Ronald and Mattes Susan
Create a Home Valuation Report for This Property
The Home Valuation Report is an in-depth analysis detailing your home's value as well as a comparison with similar homes in the area
Home Values in the Area
Average Home Value in this Area
Purchase History
| Date | Buyer | Sale Price | Title Company |
|---|---|---|---|
| Lee Richard S | $280,521 | None Listed On Document | |
| Lee Richard S | $280,521 | None Listed On Document | |
| Lee Randolph M | $25,000 | None Available | |
| Lee Randolph M | $512,500 | -- | |
| Onimus Frank S | $220,000 | -- | |
| Mattes Ronald | -- | -- |
Source: Public Records
Mortgage History
| Date | Status | Borrower | Loan Amount |
|---|---|---|---|
| Previous Owner | Lee Randolph M | $300,000 |
Source: Public Records
Tax History Compared to Growth
Tax History
| Year | Tax Paid | Tax Assessment Tax Assessment Total Assessment is a certain percentage of the fair market value that is determined by local assessors to be the total taxable value of land and additions on the property. | Land | Improvement |
|---|---|---|---|---|
| 2025 | $7,741 | $689,900 | $540,000 | $149,900 |
| 2024 | $7,741 | $689,900 | $540,000 | $149,900 |
| 2023 | $7,389 | $689,900 | $540,000 | $149,900 |
| 2022 | $7,099 | $689,900 | $540,000 | $149,900 |
| 2021 | $5,147 | $689,900 | $540,000 | $149,900 |
| 2020 | $6,747 | $689,900 | $540,000 | $149,900 |
| 2019 | $6,671 | $689,900 | $540,000 | $149,900 |
| 2018 | $6,609 | $689,900 | $540,000 | $149,900 |
| 2017 | $6,506 | $689,900 | $540,000 | $149,900 |
| 2016 | $6,257 | $689,900 | $540,000 | $149,900 |
| 2015 | $6,175 | $689,900 | $540,000 | $149,900 |
| 2014 | $6,085 | $689,900 | $540,000 | $149,900 |
Source: Public Records
Map
Nearby Homes
- 305 57th St Unit 305
- 5512 Asbury Ave
- 400 E 55th St Unit D
- 400 E 55th St Unit E
- 400 E 55th St Unit F
- 5404 Bay Ave
- 5315 West Ave
- 216 Anchorage Dr
- 209 Bark Dr
- 5235 Central Ave
- 13 53rd St
- 5242 West Ave Unit 2
- 5225 Asbury Ave Unit 1
- 5132 Central Ave
- 4933 Central Ave Unit 4933
- 4919 Central Ave
- 4923 Central Ave Unit 2
- 4828 West Ave Unit first floor
- 4818-20 Asbury Ave
- 4818 Asbury Ave Unit 1
- 5828 Central Ave Unit 30
- 5824 Central Ave Unit 5824A
- 5824 Central Ave Unit 26
- 5824 Central Ave Unit 26
- 5832 Central Ave Unit 1st Floor
- 5832 Central Ave Unit 34
- 5832 Central Ave Unit 34
- 5832 Central Ave Unit 1
- 5820 Central Ave Unit 22
- 5820 Central Ave Unit 22
- 5820 Central Ave Unit 1st floor
- 5836 Central Ave Unit 1
- 5836 Central Ave Unit 1st Floor
- 5836 Central Ave Unit 38
- 5836 Central Ave Unit 38
- 5816 Central Ave Unit 18
- 5816 Central Ave Unit 18
- 5841 Asbury Ave Unit 43
- 5841 Asbury Ave Unit 43
- 5829 Asbury Ave Unit 31