Estimated Value: $286,301 - $332,000
3
Beds
2
Baths
1,991
Sq Ft
$153/Sq Ft
Est. Value
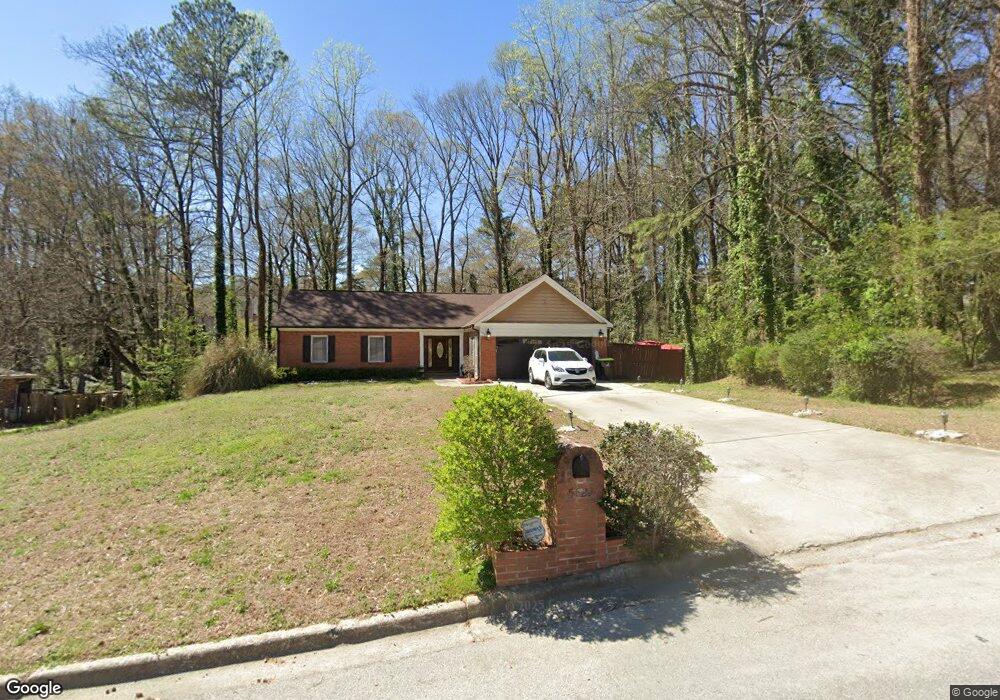
About This Home
This home is located at 5829 Foxfield Trail, Rex, GA 30273 and is currently estimated at $305,325, approximately $153 per square foot. 5829 Foxfield Trail is a home located in Clayton County with nearby schools including Roberta T. Smith Elementary School, Adamson Middle School, and Morrow High School.
Ownership History
Date
Name
Owned For
Owner Type
Purchase Details
Closed on
Jan 15, 2025
Sold by
Bacon Vince D
Bought by
Reeves Ignatius
Current Estimated Value
Home Financials for this Owner
Home Financials are based on the most recent Mortgage that was taken out on this home.
Original Mortgage
$10,000
Outstanding Balance
$9,911
Interest Rate
6.72%
Mortgage Type
New Conventional
Estimated Equity
$295,414
Purchase Details
Closed on
Jul 24, 2002
Sold by
White and White Bacon Kimberly
Bought by
Bacon Vince D
Purchase Details
Closed on
Dec 12, 1996
Sold by
Harper Roger Cheryl
Bought by
Bacon Vince and White Kimberly
Purchase Details
Closed on
May 27, 1993
Sold by
Davis Brenda J Marlin Ti
Bought by
Harper Roger Cheryl
Home Financials for this Owner
Home Financials are based on the most recent Mortgage that was taken out on this home.
Original Mortgage
$74,150
Interest Rate
10%
Mortgage Type
FHA
Create a Home Valuation Report for This Property
The Home Valuation Report is an in-depth analysis detailing your home's value as well as a comparison with similar homes in the area
Home Values in the Area
Average Home Value in this Area
Purchase History
| Date | Buyer | Sale Price | Title Company |
|---|---|---|---|
| Reeves Ignatius | $297,000 | -- | |
| Bacon Vince D | -- | -- | |
| Bacon Vince | $26,900 | -- | |
| Harper Roger Cheryl | $10,000 | -- |
Source: Public Records
Mortgage History
| Date | Status | Borrower | Loan Amount |
|---|---|---|---|
| Open | Reeves Ignatius | $10,000 | |
| Open | Reeves Ignatius | $291,620 | |
| Previous Owner | Harper Roger Cheryl | $74,150 | |
| Closed | Bacon Vince | $0 |
Source: Public Records
Tax History
| Year | Tax Paid | Tax Assessment Tax Assessment Total Assessment is a certain percentage of the fair market value that is determined by local assessors to be the total taxable value of land and additions on the property. | Land | Improvement |
|---|---|---|---|---|
| 2025 | $1,344 | $80,000 | $8,000 | $72,000 |
| 2024 | $1,394 | $80,000 | $8,000 | $72,000 |
| 2023 | $2,888 | $80,000 | $8,000 | $72,000 |
| 2022 | $1,095 | $65,080 | $8,000 | $57,080 |
| 2021 | $956 | $57,240 | $8,000 | $49,240 |
| 2020 | $919 | $54,198 | $8,000 | $46,198 |
| 2019 | $883 | $51,176 | $7,200 | $43,976 |
| 2018 | $835 | $48,826 | $7,200 | $41,626 |
| 2017 | $745 | $42,862 | $7,200 | $35,662 |
| 2016 | $782 | $44,571 | $7,200 | $37,371 |
| 2015 | $768 | $0 | $0 | $0 |
| 2014 | $538 | $35,159 | $7,200 | $27,959 |
Source: Public Records
Map
Nearby Homes
- 5679 Jubilant Dr
- 5847 Pinetree Ln
- 5747 Rex Mill Creek
- 3836 Rex Cir
- 3821 Rex Mill Square
- 6132 Christopher Terrace Unit 3
- 232 Clarkdell Dr
- 176 Stokes Dr
- 3839 Teton Pass
- 3777 Teton Pass
- 6320 Headwaters Way
- 5861 Colonnade Dr
- 3709 Charlotte Dr
- 5678 Washakie Point
- 245 Remington Trail
- 7001 Coatsworth Dr Unit LOT 1
- 3684 Paddington Trail
- 260 Remington Trail Unit 2
- 3668 Paddington Trail
- 51 Ac Rex Rd
- 5815 Foxfield Trail
- 5832 Saddlemont Ct
- 5844 Saddlemont Ct Unit 4
- 5805 Foxfield Trail
- 5854 Saddlemont Ct
- 5828 Foxfield Trail Unit 4
- 5816 Foxfield Trail
- 5840 Foxfield Trail
- 5848 Foxfield Trail
- 5828 Saddlemont Ct
- 5804 Foxfield Trail
- 5856 Foxfield Trail
- 5793 Foxfield Trail
- 4139 Renard Way Unit 6
- 4149 Renard Way Unit 6
- 5794 Foxfield Trail
- 5864 Foxfield Trail
- 5847 Saddlemont Ct
- 5857 Saddlemont Ct
- 5835 Saddlemont Ct
Your Personal Tour Guide
Ask me questions while you tour the home.