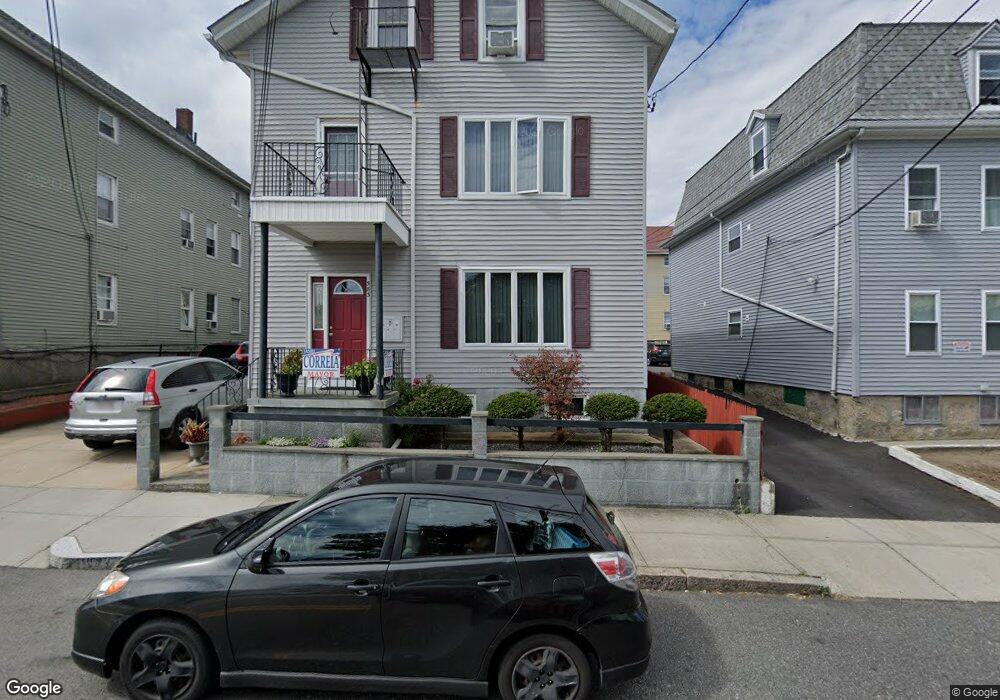
583 4th St Unit 3rd flr Fall River, MA 02721
Corky Row NeighborhoodEstimated Value: $510,000 - $711,000
2
Beds
1
Bath
3,842
Sq Ft
$159/Sq Ft
Est. Value
About This Home
This home is located at 583 4th St Unit 3rd flr, Fall River, MA 02721 and is currently estimated at $608,996, approximately $158 per square foot. 583 4th St Unit 3rd flr is a home located in Bristol County with nearby schools including Henry Lord Community School, B M C Durfee High School, and Argosy Collegiate Charter School.
Ownership History
Date
Name
Owned For
Owner Type
Purchase Details
Closed on
Feb 1, 1999
Sold by
Pinto Joe M and Pinto Maria F
Bought by
Correia Hermano C and Correia Maria
Current Estimated Value
Home Financials for this Owner
Home Financials are based on the most recent Mortgage that was taken out on this home.
Original Mortgage
$108,000
Outstanding Balance
$25,409
Interest Rate
6.67%
Mortgage Type
Purchase Money Mortgage
Estimated Equity
$583,587
Create a Home Valuation Report for This Property
The Home Valuation Report is an in-depth analysis detailing your home's value as well as a comparison with similar homes in the area
Home Values in the Area
Average Home Value in this Area
Purchase History
| Date | Buyer | Sale Price | Title Company |
|---|---|---|---|
| Correia Hermano C | $138,000 | -- |
Source: Public Records
Mortgage History
| Date | Status | Borrower | Loan Amount |
|---|---|---|---|
| Open | Correia Hermano C | $108,000 | |
| Previous Owner | Correia Hermano C | $110,500 |
Source: Public Records
Tax History Compared to Growth
Tax History
| Year | Tax Paid | Tax Assessment Tax Assessment Total Assessment is a certain percentage of the fair market value that is determined by local assessors to be the total taxable value of land and additions on the property. | Land | Improvement |
|---|---|---|---|---|
| 2025 | $6,433 | $561,800 | $102,400 | $459,400 |
| 2024 | $6,105 | $531,300 | $95,700 | $435,600 |
| 2023 | $5,088 | $414,700 | $80,300 | $334,400 |
| 2022 | $4,510 | $357,400 | $76,400 | $281,000 |
| 2021 | $4,121 | $298,000 | $73,100 | $224,900 |
| 2020 | $3,678 | $254,500 | $70,700 | $183,800 |
| 2019 | $3,161 | $216,800 | $70,700 | $146,100 |
| 2018 | $2,939 | $201,000 | $74,900 | $126,100 |
| 2017 | $2,814 | $201,000 | $74,900 | $126,100 |
| 2016 | $2,928 | $214,800 | $91,700 | $123,100 |
| 2015 | $2,768 | $211,600 | $88,200 | $123,400 |
| 2014 | $2,927 | $232,700 | $97,900 | $134,800 |
Source: Public Records
Map
Nearby Homes