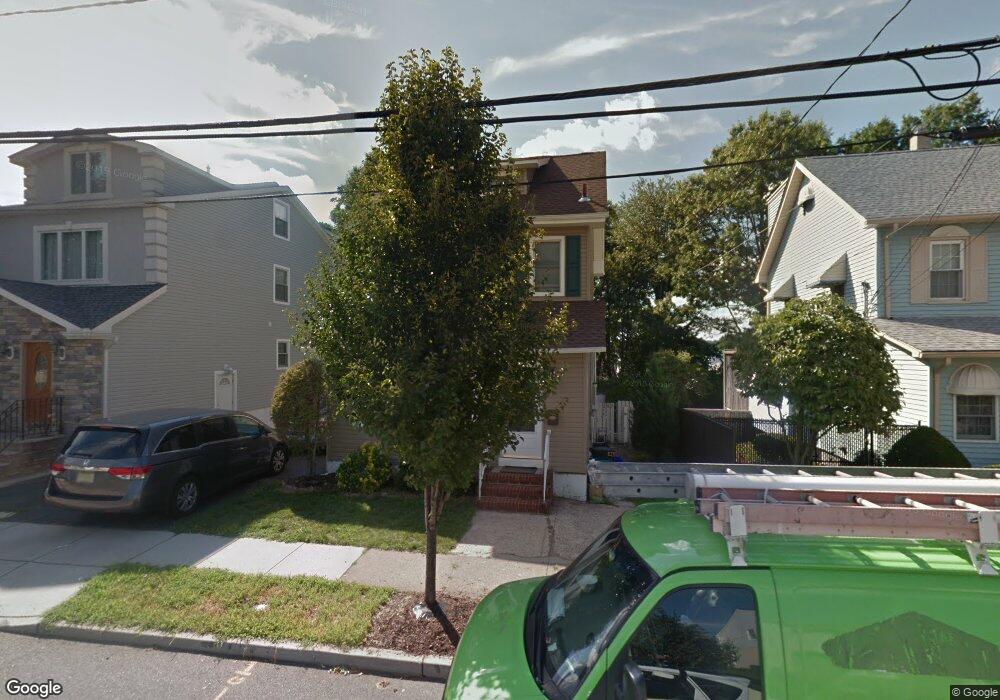
583 Chase Ave Lyndhurst, NJ 07071
Estimated Value: $586,000 - $671,000
4
Beds
2
Baths
1,490
Sq Ft
$423/Sq Ft
Est. Value
About This Home
This home is located at 583 Chase Ave, Lyndhurst, NJ 07071 and is currently estimated at $630,800, approximately $423 per square foot. 583 Chase Ave is a home located in Bergen County with nearby schools including Lyndhurst High School and Sacred Heart School.
Ownership History
Date
Name
Owned For
Owner Type
Purchase Details
Closed on
Nov 3, 2008
Sold by
Carroll Kevin and Carroll James
Bought by
Pallante Louis A and Lee Ginnie K
Current Estimated Value
Purchase Details
Closed on
Aug 5, 2005
Sold by
Tricoli Frank
Bought by
Carroll Kevin and Carroll James
Home Financials for this Owner
Home Financials are based on the most recent Mortgage that was taken out on this home.
Original Mortgage
$381,150
Interest Rate
5.66%
Create a Home Valuation Report for This Property
The Home Valuation Report is an in-depth analysis detailing your home's value as well as a comparison with similar homes in the area
Home Values in the Area
Average Home Value in this Area
Purchase History
| Date | Buyer | Sale Price | Title Company |
|---|---|---|---|
| Pallante Louis A | $325,000 | -- | |
| Carroll Kevin | $385,000 | -- |
Source: Public Records
Mortgage History
| Date | Status | Borrower | Loan Amount |
|---|---|---|---|
| Previous Owner | Carroll Kevin | $381,150 |
Source: Public Records
Tax History
| Year | Tax Paid | Tax Assessment Tax Assessment Total Assessment is a certain percentage of the fair market value that is determined by local assessors to be the total taxable value of land and additions on the property. | Land | Improvement |
|---|---|---|---|---|
| 2025 | $10,255 | $497,600 | $313,400 | $184,200 |
| 2024 | $9,886 | $491,600 | $309,400 | $182,200 |
| 2023 | $8,660 | $486,500 | $306,400 | $180,100 |
| 2022 | $8,660 | $273,000 | $169,500 | $103,500 |
| 2021 | $8,299 | $273,000 | $169,500 | $103,500 |
| 2020 | $8,119 | $273,000 | $169,500 | $103,500 |
| 2019 | $8,059 | $273,000 | $169,500 | $103,500 |
| 2018 | $8,124 | $273,000 | $169,500 | $103,500 |
| 2017 | $7,920 | $273,000 | $169,500 | $103,500 |
| 2016 | $7,374 | $260,000 | $169,500 | $90,500 |
| 2015 | $7,142 | $260,000 | $169,500 | $90,500 |
| 2014 | $7,049 | $260,000 | $169,500 | $90,500 |
Source: Public Records
Map
Nearby Homes
Your Personal Tour Guide
Ask me questions while you tour the home.