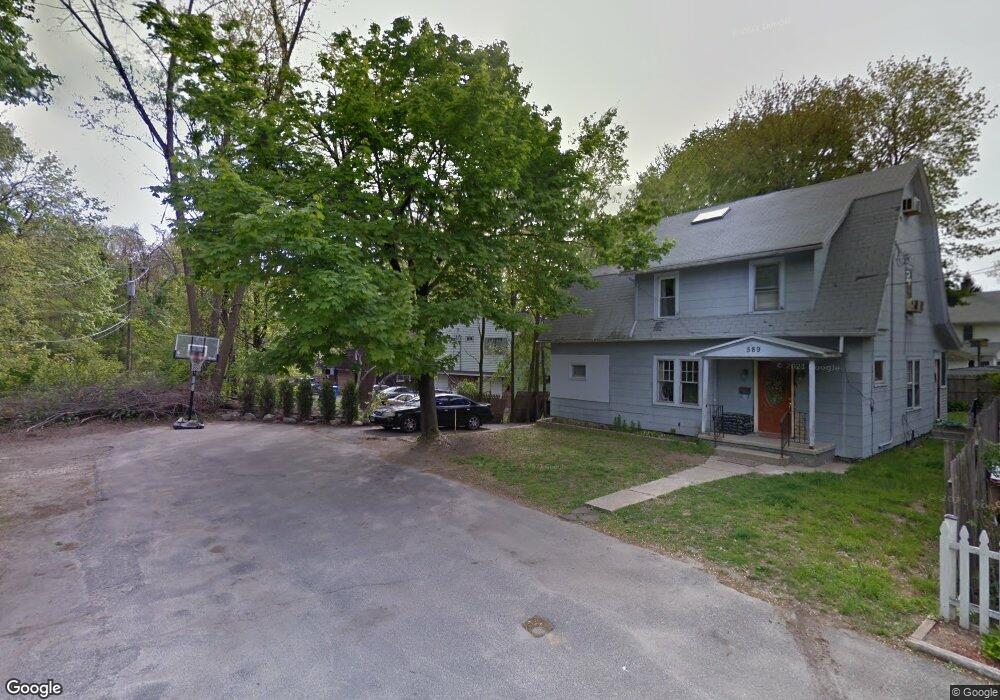
583 Columbia Boulevard Extension Waterbury, CT 06704
North End District NeighborhoodEstimated Value: $307,925 - $386,000
3
Beds
2
Baths
1,476
Sq Ft
$236/Sq Ft
Est. Value
About This Home
This home is located at 583 Columbia Boulevard Extension, Waterbury, CT 06704 and is currently estimated at $348,231, approximately $235 per square foot. 583 Columbia Boulevard Extension is a home located in New Haven County with nearby schools including F. J. Kingsbury School, North End Middle School, and Wilby High School.
Ownership History
Date
Name
Owned For
Owner Type
Purchase Details
Closed on
Dec 20, 2021
Sold by
Mazel Apartments Llc
Bought by
Patriot Apartments Llc
Current Estimated Value
Purchase Details
Closed on
May 11, 2011
Sold by
Handelsman Shiimon
Bought by
Mazel Apartments Llc
Purchase Details
Closed on
Jun 30, 2010
Sold by
Gordon Stacey-Ann
Bought by
Deutsche Bank Natl T C
Purchase Details
Closed on
Feb 6, 2006
Sold by
Adaams 2 Llc
Bought by
Gordon Stacey Ann
Home Financials for this Owner
Home Financials are based on the most recent Mortgage that was taken out on this home.
Original Mortgage
$223,150
Interest Rate
6.31%
Mortgage Type
Purchase Money Mortgage
Purchase Details
Closed on
Aug 7, 2000
Sold by
Gray Arthur S and Gray Elaine K
Bought by
Nazario Luis A and Testa Michael J
Create a Home Valuation Report for This Property
The Home Valuation Report is an in-depth analysis detailing your home's value as well as a comparison with similar homes in the area
Home Values in the Area
Average Home Value in this Area
Purchase History
| Date | Buyer | Sale Price | Title Company |
|---|---|---|---|
| Patriot Apartments Llc | -- | None Available | |
| Mazel Apartments Llc | -- | -- | |
| Handelsman Shimon | $63,000 | -- | |
| Deutsche Bank Natl T C | -- | -- | |
| Gordon Stacey Ann | $234,900 | -- | |
| Nazario Luis A | $112,000 | -- |
Source: Public Records
Mortgage History
| Date | Status | Borrower | Loan Amount |
|---|---|---|---|
| Previous Owner | Nazario Luis A | $1,108,800 | |
| Previous Owner | Nazario Luis A | $223,150 | |
| Previous Owner | Nazario Luis A | $60,000 |
Source: Public Records
Tax History Compared to Growth
Tax History
| Year | Tax Paid | Tax Assessment Tax Assessment Total Assessment is a certain percentage of the fair market value that is determined by local assessors to be the total taxable value of land and additions on the property. | Land | Improvement |
|---|---|---|---|---|
| 2025 | $7,434 | $165,270 | $23,030 | $142,240 |
| 2024 | $8,171 | $165,270 | $23,030 | $142,240 |
| 2023 | $8,956 | $165,270 | $23,030 | $142,240 |
| 2022 | $5,824 | $96,720 | $23,010 | $73,710 |
| 2021 | $5,824 | $96,720 | $23,010 | $73,710 |
| 2020 | $5,824 | $96,720 | $23,010 | $73,710 |
| 2019 | $5,824 | $96,720 | $23,010 | $73,710 |
| 2018 | $5,824 | $96,720 | $23,010 | $73,710 |
| 2017 | $5,317 | $88,300 | $23,010 | $65,290 |
| 2016 | $5,317 | $88,300 | $23,010 | $65,290 |
| 2015 | $5,141 | $88,300 | $23,010 | $65,290 |
| 2014 | $5,141 | $88,300 | $23,010 | $65,290 |
Source: Public Records
Map
Nearby Homes
- 578 Columbia Boulevard Extension
- 102 Waverly St
- 307 Dwight St
- 60 Grace Ave
- 57 Grace Ave
- 468 Perkins Ave
- 26 Herkimer St
- 138 Williamson Dr
- 135 Williamson Dr
- 124 Williamson Dr
- 335 Perkins Ave Unit 7
- 180 Monmouth Ave
- 91 Clinton St
- 42 Concord St
- 651 Cooke St
- 19 Collins St
- 74 Macarthur Dr
- 139 Chester Ave
- 0 Chester Ave
- 90 Chester Ave
- 577 Columbia Blvd
- 0 Columbia Boulevard Extension
- 577 Columbia Boulevard Extension
- 577 Columbia Boulevard Extension Unit right and left sides
- 583 Columbia Blvd Unit 1
- 583 Columbia Blvd Unit LFT
- 589 Columbia Boulevard Extension
- 590 Columbia Boulevard Extension
- 568 Columbia Boulevard Extension
- 568 Columbia Blvd
- 562 Columbia Boulevard Extension
- 589 Columbia Boulevard Extension
- 558 Columbia Boulevard Extension
- 89 Lone Oak Ave
- 591 Columbia Boulevard Extension
- 80 Lone Oak Ave
- 90 Faber Ave
- 82 Faber Ave
- 96 Faber Ave
- 78 Faber Ave