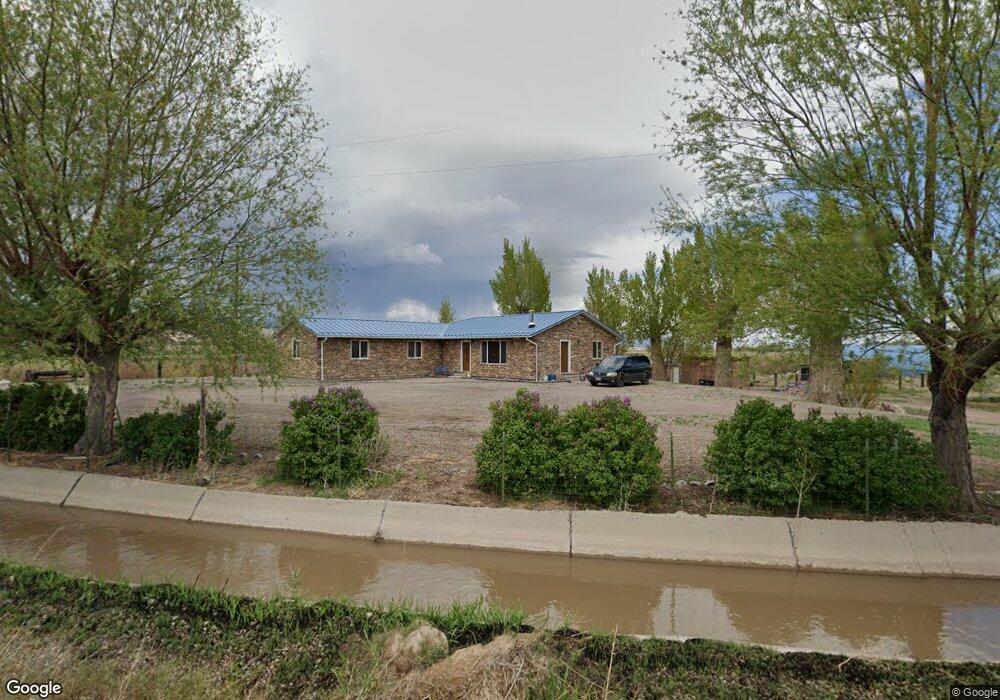
583 E 2200 N Monroe, UT 84754
Estimated Value: $381,609 - $549,000
--
Bed
--
Bath
2,216
Sq Ft
$202/Sq Ft
Est. Value
About This Home
This home is located at 583 E 2200 N, Monroe, UT 84754 and is currently estimated at $447,652, approximately $202 per square foot. 583 E 2200 N is a home with nearby schools including Monroe School, South Sevier Middle School, and South Sevier High School.
Ownership History
Date
Name
Owned For
Owner Type
Purchase Details
Closed on
Sep 6, 2023
Sold by
Justin And Alycia Jensen Trust
Bought by
Justin And Alycia Jensen Trust and Jensen
Current Estimated Value
Home Financials for this Owner
Home Financials are based on the most recent Mortgage that was taken out on this home.
Original Mortgage
$105,303
Outstanding Balance
$89,651
Interest Rate
6.96%
Mortgage Type
New Conventional
Estimated Equity
$358,001
Purchase Details
Closed on
Jun 21, 2021
Sold by
Jensen Justin Peter and Jensen Family Irrevocable Trus
Bought by
Jensen Justin Peter and Jensen Alycia Lenna
Purchase Details
Closed on
Jul 18, 2014
Sold by
Jensen Justin Peter
Bought by
Justin And Alycia Jensen Trust and Jensen Alycia Lenna
Purchase Details
Closed on
Oct 31, 2013
Sold by
Foreman Claude D and Foreman Claude
Bought by
Ence Darren J and Ence Lisa A
Purchase Details
Closed on
Sep 13, 2007
Sold by
Jensen George Daniel
Bought by
Jensen Justin Peter
Create a Home Valuation Report for This Property
The Home Valuation Report is an in-depth analysis detailing your home's value as well as a comparison with similar homes in the area
Home Values in the Area
Average Home Value in this Area
Purchase History
| Date | Buyer | Sale Price | Title Company |
|---|---|---|---|
| Justin And Alycia Jensen Trust | -- | First American Title | |
| Jensen Justin Peter | -- | Accommodation | |
| Justin And Alycia Jensen Trust | -- | None Available | |
| Ence Darren J | -- | D Land Title | |
| Jensen Justin Peter | -- | None Available |
Source: Public Records
Mortgage History
| Date | Status | Borrower | Loan Amount |
|---|---|---|---|
| Open | Justin And Alycia Jensen Trust | $105,303 |
Source: Public Records
Tax History Compared to Growth
Tax History
| Year | Tax Paid | Tax Assessment Tax Assessment Total Assessment is a certain percentage of the fair market value that is determined by local assessors to be the total taxable value of land and additions on the property. | Land | Improvement |
|---|---|---|---|---|
| 2024 | $1,683 | $203,039 | $36,655 | $166,384 |
| 2023 | $1,432 | $163,438 | $32,282 | $131,156 |
| 2022 | $1,502 | $152,791 | $21,635 | $131,156 |
| 2021 | $1,316 | $112,416 | $15,415 | $97,001 |
| 2020 | $1,270 | $102,608 | $14,715 | $87,893 |
| 2019 | $1,112 | $95,980 | $14,010 | $81,970 |
| 2018 | $1,132 | $86,870 | $14,010 | $72,860 |
| 2017 | $1,155 | $84,760 | $12,000 | $72,760 |
| 2016 | $892 | $84,760 | $0 | $0 |
| 2015 | $892 | $84,760 | $0 | $0 |
| 2014 | $892 | $84,760 | $0 | $0 |
Source: Public Records
Map
Nearby Homes
- 986 E 2290 N
- 1157 E 2350 N Unit 1
- 0 E Landslide Rd Unit 1
- 371 E 1200 S
- 170 E 400 N
- 390 N 100 W
- 340 N Main St
- 290 N 200 E
- 1025 S 800 E
- 0 Monroe Hot Springs Unit 25-258632
- 70 W 100 S
- 520 E 200 N Unit 9
- 211 N 420 E
- 162 E 200 N
- 295 N 200 W
- 80 N 200 W
- 245 N 200 W
- 45 S 200 W
- 1103 N Brooklyn Rd
- 137 N Main St
- 500 E 2500 N
- 580 E 2200 N
- 490 E 2200 N
- 487 E 2200 N
- 443 E 2200 N
- 1943 N 580 E
- 270 E 2200 N
- 2251 N Washburnville Rd
- 2221 N Washburnville Rd
- 2187 N Washburnville Rd
- 843 E 2390 N
- 2059 N Washburnville Rd
- 2520 N Washburnville Rd
- 230 E 2200 N
- 2291 N Washburnville Rd
- 225 E 2200 N
- 2635 N Washburn Rd
- 1931 N Washburnville Rd
- 201 E 2200 N
- 2321 N Washburnville Rd