Estimated Value: $58,000 - $69,000
3
Beds
1
Bath
1,124
Sq Ft
$57/Sq Ft
Est. Value
About This Home
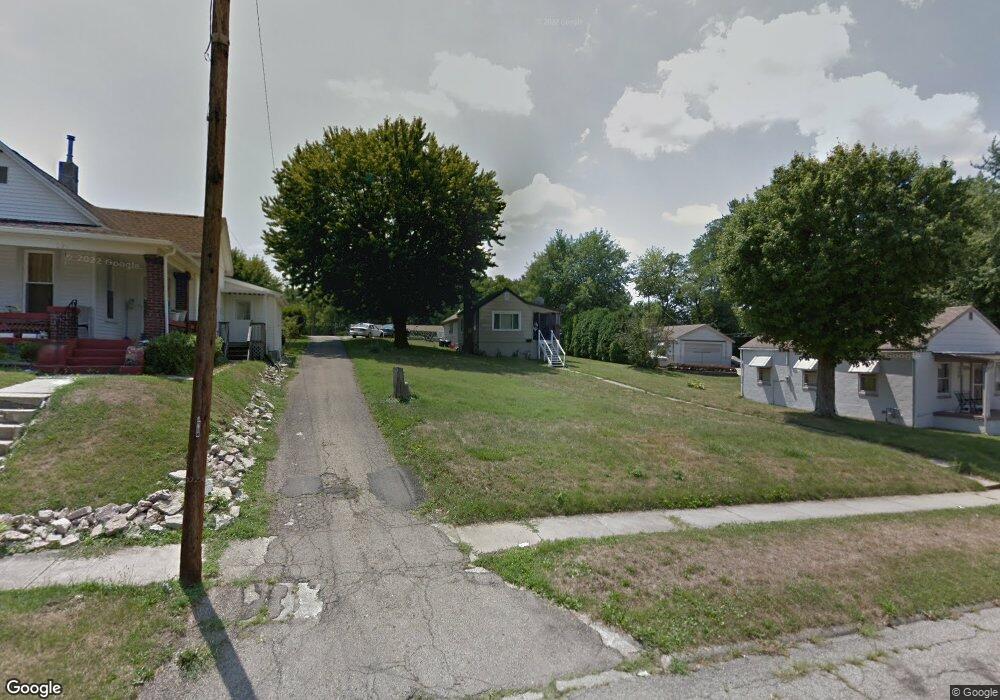
This home is located at 583 E 2nd St, Xenia, OH 45385 and is currently estimated at $63,632, approximately $56 per square foot. 583 E 2nd St is a home located in Greene County with nearby schools including Xenia High School, Summit Academy Community School for Alternative Learners - Xenia, and Legacy Christian Academy.
Ownership History
Date
Name
Owned For
Owner Type
Purchase Details
Closed on
Apr 30, 2014
Sold by
Jackson Randolph
Bought by
Jackson Paula E
Current Estimated Value
Purchase Details
Closed on
Apr 7, 2004
Sold by
Jackson Paula E and Jackson Randolph
Bought by
Jackson Randolph and Jackson Paula E
Purchase Details
Closed on
Jun 2, 1999
Sold by
Smith Raymond B
Bought by
Perry Paula E
Home Financials for this Owner
Home Financials are based on the most recent Mortgage that was taken out on this home.
Original Mortgage
$37,050
Outstanding Balance
$9,723
Interest Rate
6.99%
Estimated Equity
$53,909
Create a Home Valuation Report for This Property
The Home Valuation Report is an in-depth analysis detailing your home's value as well as a comparison with similar homes in the area
Home Values in the Area
Average Home Value in this Area
Purchase History
| Date | Buyer | Sale Price | Title Company |
|---|---|---|---|
| Jackson Paula E | -- | None Available | |
| Jackson Randolph | -- | -- | |
| Perry Paula E | $39,000 | -- |
Source: Public Records
Mortgage History
| Date | Status | Borrower | Loan Amount |
|---|---|---|---|
| Open | Perry Paula E | $37,050 |
Source: Public Records
Tax History
| Year | Tax Paid | Tax Assessment Tax Assessment Total Assessment is a certain percentage of the fair market value that is determined by local assessors to be the total taxable value of land and additions on the property. | Land | Improvement |
|---|---|---|---|---|
| 2024 | $189 | $14,520 | $2,650 | $11,870 |
| 2023 | $197 | $14,520 | $2,650 | $11,870 |
| 2022 | $91 | $10,620 | $2,410 | $8,210 |
| 2021 | $93 | $10,620 | $2,410 | $8,210 |
| 2020 | $89 | $10,620 | $2,410 | $8,210 |
| 2019 | $370 | $7,140 | $2,510 | $4,630 |
| 2018 | $371 | $7,140 | $2,510 | $4,630 |
| 2017 | $366 | $7,140 | $2,510 | $4,630 |
| 2016 | $366 | $6,920 | $2,510 | $4,410 |
| 2015 | $367 | $6,920 | $2,510 | $4,410 |
| 2014 | $342 | $6,920 | $2,510 | $4,410 |
Source: Public Records
Map
Nearby Homes
Your Personal Tour Guide
Ask me questions while you tour the home.