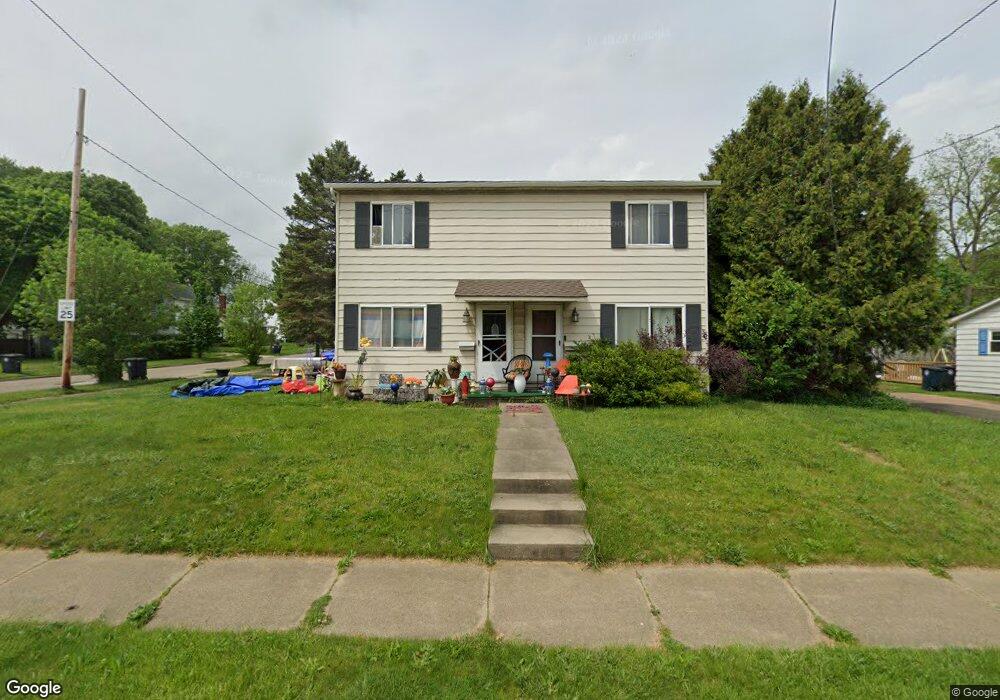
583 Evans Ave Unit 585 Akron, OH 44310
North Hill NeighborhoodEstimated Value: $137,562 - $180,000
4
Beds
2
Baths
1,664
Sq Ft
$92/Sq Ft
Est. Value
About This Home
This home is located at 583 Evans Ave Unit 585, Akron, OH 44310 and is currently estimated at $152,891, approximately $91 per square foot. 583 Evans Ave Unit 585 is a home located in Summit County with nearby schools including North High School, Edge Academy, The, and Middlebury Academy.
Ownership History
Date
Name
Owned For
Owner Type
Purchase Details
Closed on
Jul 17, 2023
Sold by
Dream Home Solutions Llc
Bought by
Mainali Babita
Current Estimated Value
Home Financials for this Owner
Home Financials are based on the most recent Mortgage that was taken out on this home.
Original Mortgage
$162,011
Outstanding Balance
$158,146
Interest Rate
6.79%
Mortgage Type
FHA
Estimated Equity
-$5,255
Purchase Details
Closed on
Sep 11, 2019
Sold by
Dhimal Udaya and Dhakal Khara N
Bought by
Dream Home Solutions Llc
Purchase Details
Closed on
Feb 26, 2018
Sold by
West James M and West Diane C
Bought by
Dhimal Udaya and Dhakal Khara N
Home Financials for this Owner
Home Financials are based on the most recent Mortgage that was taken out on this home.
Original Mortgage
$30,000
Interest Rate
3.99%
Mortgage Type
New Conventional
Purchase Details
Closed on
Sep 1, 1998
Sold by
Helen P Bailey Trst
Bought by
West James M and West Diane C
Create a Home Valuation Report for This Property
The Home Valuation Report is an in-depth analysis detailing your home's value as well as a comparison with similar homes in the area
Home Values in the Area
Average Home Value in this Area
Purchase History
| Date | Buyer | Sale Price | Title Company |
|---|---|---|---|
| Mainali Babita | $165,000 | None Listed On Document | |
| Dream Home Solutions Llc | -- | None Available | |
| Dhimal Udaya | $70,000 | None Available | |
| West James M | $70,000 | -- |
Source: Public Records
Mortgage History
| Date | Status | Borrower | Loan Amount |
|---|---|---|---|
| Open | Mainali Babita | $162,011 | |
| Previous Owner | Dhimal Udaya | $30,000 |
Source: Public Records
Tax History
| Year | Tax Paid | Tax Assessment Tax Assessment Total Assessment is a certain percentage of the fair market value that is determined by local assessors to be the total taxable value of land and additions on the property. | Land | Improvement |
|---|---|---|---|---|
| 2024 | $2,346 | $38,028 | $8,348 | $29,680 |
| 2023 | $2,346 | $38,028 | $8,348 | $29,680 |
| 2022 | $2,303 | $29,254 | $6,423 | $22,831 |
| 2021 | $2,205 | $29,254 | $6,423 | $22,831 |
| 2020 | $2,275 | $29,250 | $6,420 | $22,830 |
| 2019 | $2,289 | $28,140 | $6,160 | $21,980 |
| 2018 | $2,261 | $28,140 | $6,160 | $21,980 |
| 2017 | $2,295 | $28,140 | $6,160 | $21,980 |
| 2016 | $2,296 | $28,140 | $6,160 | $21,980 |
| 2015 | $2,295 | $28,140 | $6,160 | $21,980 |
| 2014 | $2,278 | $28,140 | $6,160 | $21,980 |
| 2013 | $2,452 | $31,210 | $6,160 | $25,050 |
Source: Public Records
Map
Nearby Homes
- 683 Ranney St
- 660 Hollibaugh Ave
- 614 Parkview Ave
- 894 Argonne Ave
- 914 Dan St
- 973 Nevin St
- 508 E Tallmadge Ave
- 559 Patterson Ave
- 495 Delmar Ave
- 225 Cranz Place
- 311 Dean St
- 336 N Adams St
- 180 Elizabeth Pkwy
- 332 Arch St
- 392 Turner St
- 1167 Hilltop Dr
- 207 Denver St
- 349 Comstock Ct
- 1193 Easton Dr
- 594 Blaine Ave
Your Personal Tour Guide
Ask me questions while you tour the home.