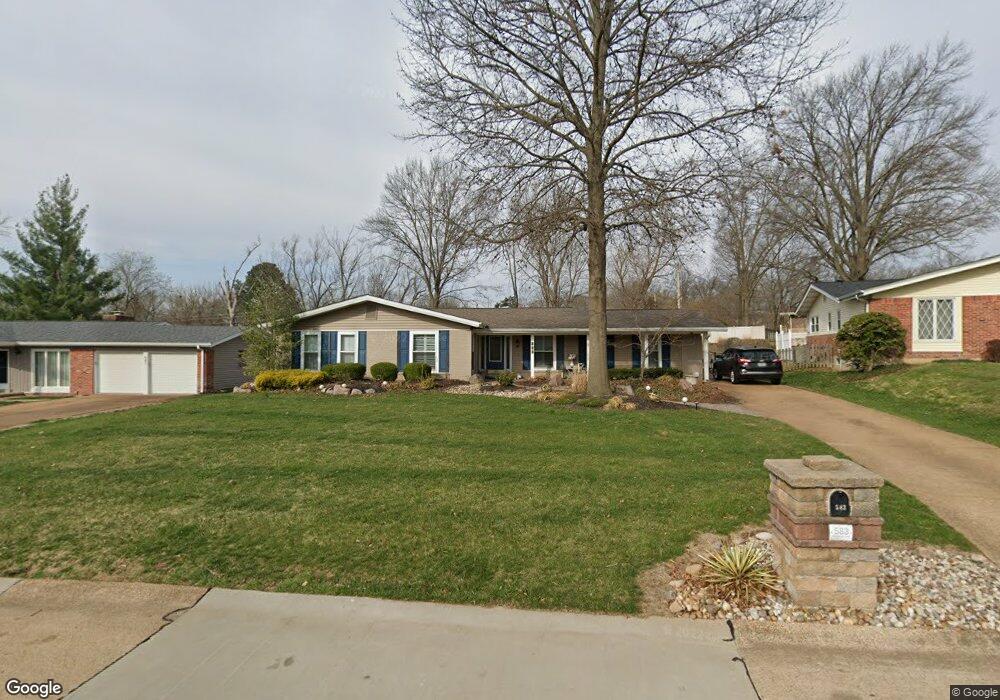
583 Fieldstone Ln Ballwin, MO 63011
Estimated Value: $377,120 - $409,000
3
Beds
2
Baths
1,685
Sq Ft
$233/Sq Ft
Est. Value
About This Home
This home is located at 583 Fieldstone Ln, Ballwin, MO 63011 and is currently estimated at $391,780, approximately $232 per square foot. 583 Fieldstone Ln is a home located in St. Louis County with nearby schools including Henry Elementary School, Parkway West Middle School, and Parkway West High School.
Ownership History
Date
Name
Owned For
Owner Type
Purchase Details
Closed on
Jan 31, 2013
Sold by
Clancy Timothy J and Clancy Robyn M
Bought by
Frankum William B and Frankum Catherine J
Current Estimated Value
Home Financials for this Owner
Home Financials are based on the most recent Mortgage that was taken out on this home.
Original Mortgage
$192,000
Outstanding Balance
$133,337
Interest Rate
3.42%
Mortgage Type
New Conventional
Estimated Equity
$258,443
Purchase Details
Closed on
Feb 28, 2006
Sold by
Burns Terence W and Burns Mary C
Bought by
Clancy Ii Timothy J and Clancy Robyn M
Home Financials for this Owner
Home Financials are based on the most recent Mortgage that was taken out on this home.
Original Mortgage
$222,300
Interest Rate
6.05%
Mortgage Type
Fannie Mae Freddie Mac
Purchase Details
Closed on
Dec 13, 2005
Sold by
Chassels Melissa
Bought by
Burns Terence and Burns Mary
Purchase Details
Closed on
Sep 19, 2005
Sold by
Burns Terence W and Burns Mary C
Bought by
Burns Terence W and Burns Mary C
Purchase Details
Closed on
Sep 2, 2005
Sold by
Chassels Loren
Bought by
Chassels Melissa
Purchase Details
Closed on
Jul 31, 2003
Sold by
Wimmer Stephen J and Wimmer Kimberly L
Bought by
Burns Terence W and Burns Mary C
Create a Home Valuation Report for This Property
The Home Valuation Report is an in-depth analysis detailing your home's value as well as a comparison with similar homes in the area
Home Values in the Area
Average Home Value in this Area
Purchase History
| Date | Buyer | Sale Price | Title Company |
|---|---|---|---|
| Frankum William B | $240,000 | Investors Title Co Clayton | |
| Clancy Ii Timothy J | $234,000 | None Available | |
| Burns Terence | -- | -- | |
| Burns Terence W | -- | -- | |
| Chassels Melissa | -- | -- | |
| Burns Terence W | $210,000 | -- |
Source: Public Records
Mortgage History
| Date | Status | Borrower | Loan Amount |
|---|---|---|---|
| Open | Frankum William B | $192,000 | |
| Previous Owner | Clancy Ii Timothy J | $222,300 |
Source: Public Records
Tax History
| Year | Tax Paid | Tax Assessment Tax Assessment Total Assessment is a certain percentage of the fair market value that is determined by local assessors to be the total taxable value of land and additions on the property. | Land | Improvement |
|---|---|---|---|---|
| 2025 | $4,032 | $69,030 | $27,990 | $41,040 |
| 2024 | $4,032 | $62,210 | $16,970 | $45,240 |
| 2023 | $4,032 | $62,210 | $16,970 | $45,240 |
| 2022 | $4,273 | $60,820 | $18,850 | $41,970 |
| 2021 | $4,248 | $60,820 | $18,850 | $41,970 |
| 2020 | $4,008 | $54,360 | $18,850 | $35,510 |
| 2019 | $3,963 | $54,360 | $18,850 | $35,510 |
| 2018 | $3,969 | $50,510 | $16,970 | $33,540 |
| 2017 | $3,856 | $50,510 | $16,970 | $33,540 |
| 2016 | $3,660 | $45,600 | $12,270 | $33,330 |
| 2015 | $3,832 | $45,600 | $12,270 | $33,330 |
| 2014 | $2,443 | $30,940 | $8,080 | $22,860 |
Source: Public Records
Map
Nearby Homes
- 102 Five Meadows Ln
- 103 Calico Ln
- 2455 Clayborn Dr Unit 2455
- 502 Iron Lantern Dr
- 426 Brooktree Dr
- 14991 Broadmont Dr
- 15066 Green Circle Dr
- 9 Chesterton Ln
- 2323 Manor Grove Dr Unit 5
- 1948 Dovershire Ct
- 500 Kingridge Dr
- 27 Chesterton Ln
- 351 Champion Way Dr
- 421 Andover Ln
- 2029 Brook Hill Ln
- 277 Oak Path Dr
- 770 Straub Rd
- 2315 Baxter Rd
- 718 Savannah Crossing Way
- 505 Glenmeadow Dr
- 581 Fieldstone Ln
- 579 Fieldstone Ln
- 585 Fieldstone Ln
- 101 Little Hill Ct
- 586 Fieldstone Ln
- 584 Fieldstone Ln
- 102 Little Hill Ct
- 588 Fieldstone Ln
- 587 Fieldstone Ln
- 582 Fieldstone Ln
- 495 Trailwood Dr
- 590 Fieldstone Ln
- 110 Little Hill Ct
- 577 Fieldstone Ln
- 103 Little Hill Ct
- 592 Fieldstone Ln
- 587 Highland Ridge Dr
- 589 Highland Ridge Dr
- 589 Fieldstone Ln
- 585 Highland Ridge Dr
Your Personal Tour Guide
Ask me questions while you tour the home.