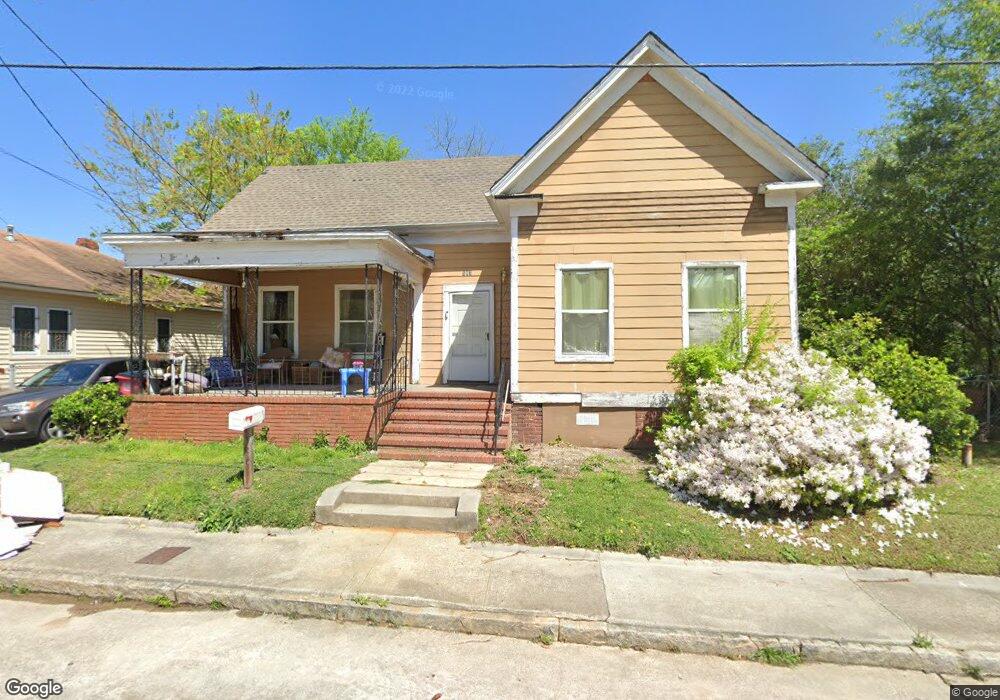
583 Nelson St Macon, GA 31206
Estimated Value: $48,000 - $69,000
4
Beds
2
Baths
1,485
Sq Ft
$39/Sq Ft
Est. Value
About This Home
This home is located at 583 Nelson St, Macon, GA 31206 and is currently estimated at $57,339, approximately $38 per square foot. 583 Nelson St is a home located in Bibb County with nearby schools including Ingram-Pye Elementary School, Central High School, and Cirrus Charter Academy.
Ownership History
Date
Name
Owned For
Owner Type
Purchase Details
Closed on
Aug 15, 2014
Sold by
Double Down Investment Group Llc
Bought by
Somma Investments Inc
Current Estimated Value
Purchase Details
Closed on
Aug 6, 2013
Sold by
Clark Delector and Clark Bettye
Bought by
Equity Trust Company and Carol Dent Ira
Purchase Details
Closed on
Jun 19, 2013
Sold by
Equity Trust Company Custodian
Bought by
Double Down Investment Group Llc
Purchase Details
Closed on
Jan 11, 2008
Sold by
Clark Delector and Clark Bettye
Bought by
Equity Trust Co and Carol Dent Ira
Purchase Details
Closed on
Sep 29, 2006
Sold by
Clark Delector
Bought by
Clark Delector and Clark Bettye
Home Financials for this Owner
Home Financials are based on the most recent Mortgage that was taken out on this home.
Original Mortgage
$46,000
Interest Rate
6.46%
Mortgage Type
Unknown
Purchase Details
Closed on
May 27, 2006
Purchase Details
Closed on
Mar 19, 2004
Purchase Details
Closed on
Dec 30, 2003
Purchase Details
Closed on
May 5, 2003
Create a Home Valuation Report for This Property
The Home Valuation Report is an in-depth analysis detailing your home's value as well as a comparison with similar homes in the area
Home Values in the Area
Average Home Value in this Area
Purchase History
| Date | Buyer | Sale Price | Title Company |
|---|---|---|---|
| Somma Investments Inc | $12,000 | None Available | |
| Equity Trust Company | $46,000 | None Available | |
| Double Down Investment Group Llc | $39,000 | None Available | |
| Equity Trust Co | $26,400 | None Available | |
| Clark Delector | -- | None Avilabale | |
| -- | -- | -- | |
| -- | -- | -- | |
| -- | -- | -- | |
| -- | $25,000 | -- |
Source: Public Records
Mortgage History
| Date | Status | Borrower | Loan Amount |
|---|---|---|---|
| Previous Owner | Clark Delector | $46,000 |
Source: Public Records
Tax History Compared to Growth
Tax History
| Year | Tax Paid | Tax Assessment Tax Assessment Total Assessment is a certain percentage of the fair market value that is determined by local assessors to be the total taxable value of land and additions on the property. | Land | Improvement |
|---|---|---|---|---|
| 2025 | $523 | $21,283 | $2,040 | $19,243 |
| 2024 | $541 | $21,283 | $2,040 | $19,243 |
| 2023 | $458 | $18,050 | $1,360 | $16,690 |
| 2022 | $475 | $13,721 | $2,124 | $11,597 |
| 2021 | $228 | $5,994 | $1,024 | $4,970 |
| 2020 | $233 | $5,994 | $1,024 | $4,970 |
| 2019 | $215 | $5,481 | $963 | $4,518 |
| 2018 | $509 | $5,481 | $963 | $4,518 |
| 2017 | $205 | $5,481 | $963 | $4,518 |
| 2016 | $190 | $5,482 | $963 | $4,518 |
| 2015 | $383 | $8,243 | $963 | $7,280 |
| 2014 | $246 | $13,097 | $963 | $12,134 |
Source: Public Records
Map
Nearby Homes
- 2758 Houston Ave
- 554 Nelson St
- 532 Nelson St
- 579 Charles St
- 678 Dixie Ave
- 534 Hanson St
- 648 Hightower Rd
- 624 Piedmont Ave
- 548 Colquitt St
- 538 Cleveland St
- 622 Cleveland St
- 2752 Antioch Rd
- 537 Colquitt St
- 561 Rutherford Ave
- 725 Saint James Ave
- 2426 2nd St
- 780 Ponce de Leon Ave
- 823 Ponce de Leon Ave
- 2382 2nd St
- 2376 2nd St