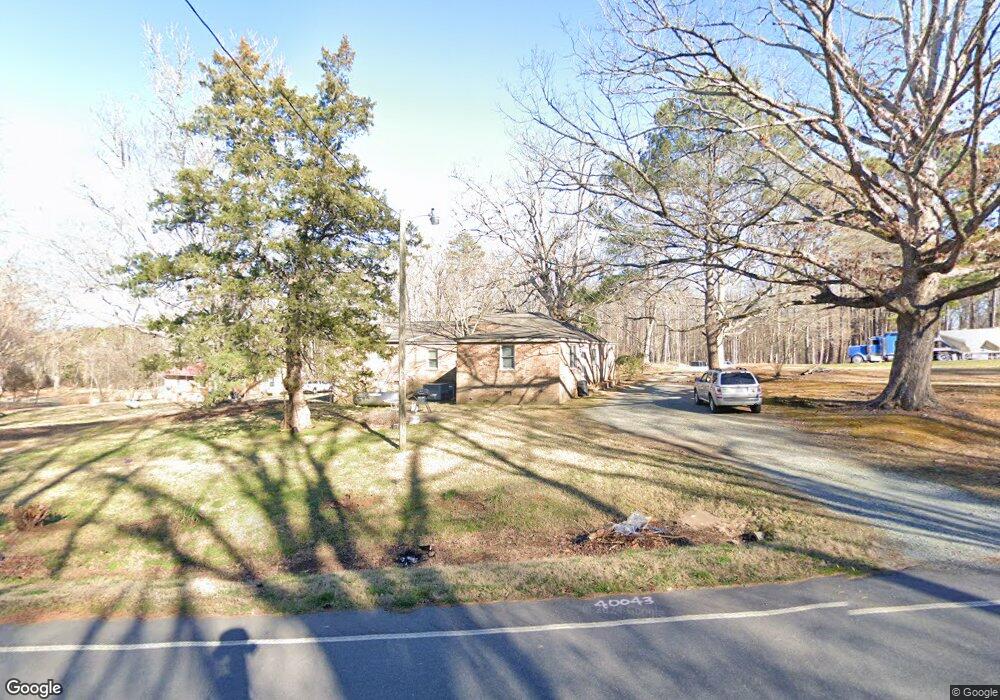
583 Old Goldston Rd Pittsboro, NC 27312
Estimated Value: $180,000 - $393,798
3
Beds
2
Baths
1,914
Sq Ft
$168/Sq Ft
Est. Value
About This Home
This home is located at 583 Old Goldston Rd, Pittsboro, NC 27312 and is currently estimated at $321,200, approximately $167 per square foot. 583 Old Goldston Rd is a home located in Chatham County with nearby schools including Pittsboro Elementary School, George Moses Horton Middle School, and Northwood High.
Ownership History
Date
Name
Owned For
Owner Type
Purchase Details
Closed on
Apr 27, 2010
Sold by
Chatham Investment Properties Llc
Bought by
Collins Jacob Thomas and Johnson Rosanna Lynn
Current Estimated Value
Home Financials for this Owner
Home Financials are based on the most recent Mortgage that was taken out on this home.
Original Mortgage
$96,000
Outstanding Balance
$62,891
Interest Rate
4.75%
Mortgage Type
New Conventional
Estimated Equity
$258,309
Purchase Details
Closed on
Dec 23, 2009
Sold by
Fannie Mae
Bought by
Chatham Investment Properties Llc
Purchase Details
Closed on
Sep 29, 2009
Sold by
Sullivan Neil Humphrey and Sullivan Betsy Ross
Bought by
Federal National Mortgage Association
Create a Home Valuation Report for This Property
The Home Valuation Report is an in-depth analysis detailing your home's value as well as a comparison with similar homes in the area
Home Values in the Area
Average Home Value in this Area
Purchase History
| Date | Buyer | Sale Price | Title Company |
|---|---|---|---|
| Collins Jacob Thomas | $95,000 | None Available | |
| Chatham Investment Properties Llc | -- | Chicago Title Insurance Co | |
| Federal National Mortgage Association | $133,163 | None Available |
Source: Public Records
Mortgage History
| Date | Status | Borrower | Loan Amount |
|---|---|---|---|
| Open | Collins Jacob Thomas | $96,000 |
Source: Public Records
Tax History Compared to Growth
Tax History
| Year | Tax Paid | Tax Assessment Tax Assessment Total Assessment is a certain percentage of the fair market value that is determined by local assessors to be the total taxable value of land and additions on the property. | Land | Improvement |
|---|---|---|---|---|
| 2025 | $2,329 | $305,889 | $53,705 | $252,184 |
| 2024 | $2,329 | $213,939 | $44,565 | $169,374 |
| 2023 | $1,993 | $213,939 | $44,565 | $169,374 |
| 2022 | $1,818 | $213,939 | $44,565 | $169,374 |
| 2021 | $1,818 | $213,939 | $44,565 | $169,374 |
| 2020 | $1,367 | $156,766 | $41,136 | $115,630 |
| 2019 | $1,367 | $156,766 | $41,136 | $115,630 |
| 2018 | $1,302 | $156,766 | $41,136 | $115,630 |
| 2017 | $1,302 | $156,766 | $41,136 | $115,630 |
| 2016 | $1,051 | $122,473 | $32,137 | $90,336 |
| 2015 | $1,037 | $122,473 | $32,137 | $90,336 |
| 2014 | $1,028 | $122,473 | $32,137 | $90,336 |
| 2013 | -- | $122,473 | $32,137 | $90,336 |
Source: Public Records
Map
Nearby Homes
- 000 Alston Chapel Rd
- 0 Nc 87 Hwy Unit 2491586
- 0 N Carolina 902
- 00 N Carolina 902
- 507 W Salisbury St
- 15 Juniper Ct
- 162 Gaines Trail
- 248 Ashford Dr
- 344 May Farm Rd
- 66 Toomer Loop Rd
- 425 Credle St
- 298 E Salisbury St
- 74 Brookridge Ct
- 230 Oakwood Dr
- 501 U S 15
- Tbd Versailles Ln
- 116 Kensington Dr
- 726 Thompson St
- 88 Daisy Scurlock Rd
- 24 Cynthia Ln
- 672 N Carolina 902
- 644 Nc Highway 902
- 533 Old Goldston Rd
- 584 Nc Highway 902
- 495 Old Goldston Rd
- 477 Old Goldston Rd
- 619 Nc Highway 902
- 619 N Carolina 902
- 60 Churchwood Ln
- 669 N Carolina 902
- 669 Nc 902 Hwy
- 000 Nc Highway 902
- 590 Old Goldston Rd
- 435 Old Goldston Rd
- 300 Woodberry Forest
- 174 Woodberry Forest
- 500 Old Goldston Rd
- 168 Woodberry Forest
- 168 Woodberry Forest Unit B
- 76 Churchwood Ln