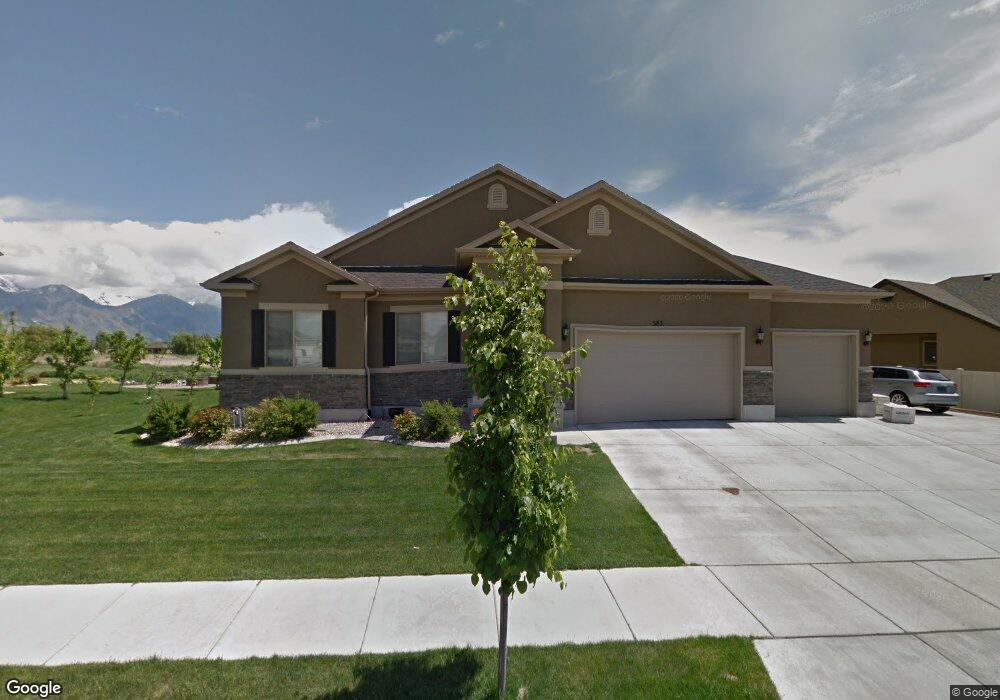
583 S Lake View Dr Vineyard, UT 84058
Sunset Heights NeighborhoodEstimated Value: $741,000 - $817,000
3
Beds
3
Baths
1,728
Sq Ft
$455/Sq Ft
Est. Value
About This Home
This home is located at 583 S Lake View Dr, Vineyard, UT 84058 and is currently estimated at $787,022, approximately $455 per square foot. 583 S Lake View Dr is a home located in Utah County with nearby schools including Vineyard Elementary School, Lakeridge Jr High School, and Mountain View High School.
Ownership History
Date
Name
Owned For
Owner Type
Purchase Details
Closed on
Mar 18, 2019
Sold by
Yi Seo Woo
Bought by
Woo Yi Seo and Park Hye Kyung
Current Estimated Value
Home Financials for this Owner
Home Financials are based on the most recent Mortgage that was taken out on this home.
Original Mortgage
$325,875
Outstanding Balance
$286,500
Interest Rate
4.4%
Mortgage Type
New Conventional
Estimated Equity
$500,522
Purchase Details
Closed on
Jul 8, 2011
Sold by
D R Horton Inc
Bought by
Pickering Matthew A and Pickering Beverly J
Home Financials for this Owner
Home Financials are based on the most recent Mortgage that was taken out on this home.
Original Mortgage
$281,090
Interest Rate
4.54%
Mortgage Type
FHA
Purchase Details
Closed on
May 19, 2010
Sold by
Sleepy Holdings Llc
Bought by
D R Horton Inc
Purchase Details
Closed on
Jul 31, 2009
Sold by
The Lakes At Sleepy Ridge Inc
Bought by
Sleepy Holdings Llc
Create a Home Valuation Report for This Property
The Home Valuation Report is an in-depth analysis detailing your home's value as well as a comparison with similar homes in the area
Home Values in the Area
Average Home Value in this Area
Purchase History
| Date | Buyer | Sale Price | Title Company |
|---|---|---|---|
| Woo Yi Seo | -- | Provo Land Title Co | |
| Yi Seo Woo | -- | Inwest Title | |
| Pickering Matthew A | -- | Provo Land Title Company | |
| D R Horton Inc | -- | Utah Commercial Title | |
| Sleepy Holdings Llc | -- | Utah Commercial Title |
Source: Public Records
Mortgage History
| Date | Status | Borrower | Loan Amount |
|---|---|---|---|
| Open | Yi Seo Woo | $325,875 | |
| Previous Owner | Pickering Matthew A | $281,090 |
Source: Public Records
Tax History
| Year | Tax Paid | Tax Assessment Tax Assessment Total Assessment is a certain percentage of the fair market value that is determined by local assessors to be the total taxable value of land and additions on the property. | Land | Improvement |
|---|---|---|---|---|
| 2025 | $4,152 | $440,495 | -- | -- |
| 2024 | $4,152 | $389,510 | $0 | $0 |
| 2023 | $3,691 | $386,870 | $0 | $0 |
| 2022 | $3,630 | $369,875 | $0 | $0 |
| 2021 | $3,195 | $499,100 | $236,400 | $262,700 |
| 2020 | $2,980 | $465,100 | $214,900 | $250,200 |
| 2019 | $2,702 | $455,300 | $195,400 | $259,900 |
| 2018 | $3,080 | $455,300 | $195,400 | $259,900 |
| 2017 | $2,800 | $223,080 | $0 | $0 |
| 2016 | $2,739 | $217,140 | $0 | $0 |
| 2015 | $2,433 | $193,710 | $0 | $0 |
| 2014 | $2,115 | $169,455 | $0 | $0 |
Source: Public Records
Map
Nearby Homes
- 167 E Lake View Dr
- 2 W Stillwater St Unit 144
- 3 W Stillwater St Unit 161
- 481 S Main St Unit Lot 139
- 441 S Main St Unit 135
- 344 S Tahoe St
- 12 W Stillwater St Unit 148
- 16 W Stillwater St Unit 150
- 198 E Zinfandel Ln
- 674 S Lake View Dr Unit 337
- 71 E Powell St Unit 106
- 338 S Holdaway Rd
- 1863 W 645 S
- 894 S 2100 W
- 1963 W Golden Pond Way
- 943 S 2150 W
- 583 E Parker Place
- 713 S 1803 W
- 1813 W 795 S Unit 231
- 261 S Aspen Way
- 583 S Lake View Dr
- 591 S Lake View Dr
- 577 S Lake View Dr
- 577 S Lake View Dr
- 578 S Lake View Dr
- 578 S Lake View Dr
- 586 S Lake View Dr
- 571 S Lake View Dr Unit 210
- 571 S Lake View Dr
- 571 S Lake View Dr
- 566 S Lake View Dr Unit 292
- 566 S Lake View Dr
- 594 S Lake View Dr
- 232 E Lake View Dr Unit 362
- 232 E Lake View Dr
- 232 E Lake View Dr Unit 362
- 241 E 430 S Unit 305
- 241 E Lake View Dr
- 567 S 195 E
- 563 S Lake View Dr
Your Personal Tour Guide
Ask me questions while you tour the home.