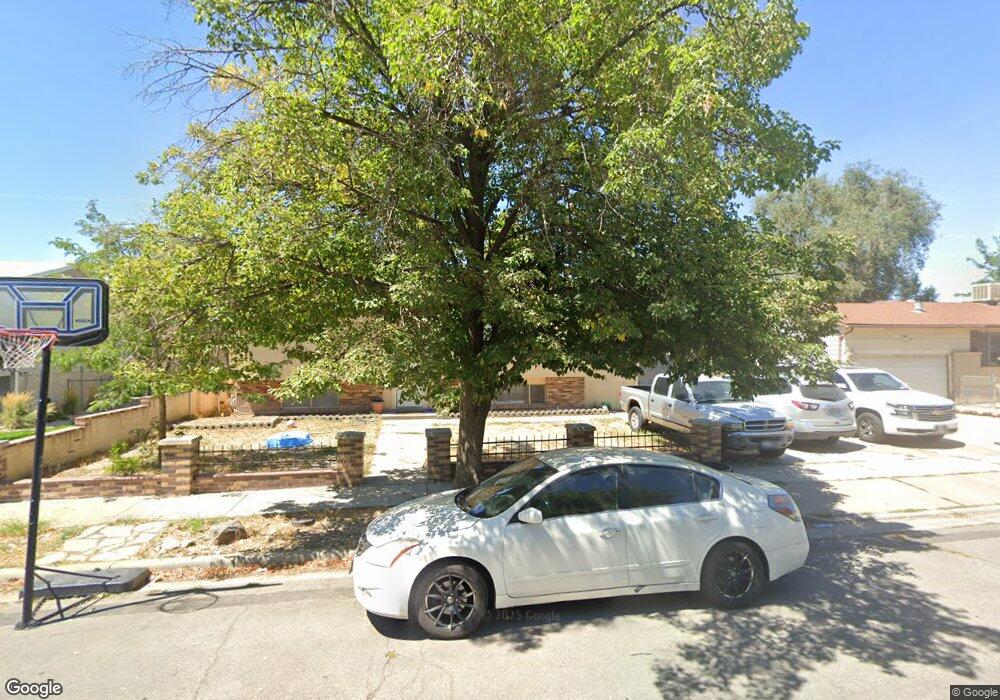
583 Sir Philip Dr Salt Lake City, UT 84116
Jordan Meadows NeighborhoodEstimated Value: $417,000 - $444,000
3
Beds
1
Bath
976
Sq Ft
$441/Sq Ft
Est. Value
About This Home
This home is located at 583 Sir Philip Dr, Salt Lake City, UT 84116 and is currently estimated at $430,857, approximately $441 per square foot. 583 Sir Philip Dr is a home located in Salt Lake County with nearby schools including Meadowlark School, Northwest Middle School, and West High.
Ownership History
Date
Name
Owned For
Owner Type
Purchase Details
Closed on
Dec 26, 2023
Sold by
Fiefia Finau
Bought by
Fiefia Finau and Fiefia Charles
Current Estimated Value
Home Financials for this Owner
Home Financials are based on the most recent Mortgage that was taken out on this home.
Original Mortgage
$287,300
Interest Rate
7.5%
Mortgage Type
Credit Line Revolving
Purchase Details
Closed on
Sep 14, 2000
Sold by
Fiefia Sione V
Bought by
Fiefia Sione and Fiefia Finau
Home Financials for this Owner
Home Financials are based on the most recent Mortgage that was taken out on this home.
Original Mortgage
$92,250
Interest Rate
9.5%
Purchase Details
Closed on
Jan 13, 1997
Sold by
Fiefia Sione V and Fiefia Finau A
Bought by
Fiefia Sione
Home Financials for this Owner
Home Financials are based on the most recent Mortgage that was taken out on this home.
Original Mortgage
$80,800
Interest Rate
7.46%
Create a Home Valuation Report for This Property
The Home Valuation Report is an in-depth analysis detailing your home's value as well as a comparison with similar homes in the area
Home Values in the Area
Average Home Value in this Area
Purchase History
| Date | Buyer | Sale Price | Title Company |
|---|---|---|---|
| Fiefia Finau | -- | Utah First Title Insurance Age | |
| Fiefia Sione | -- | Equity Title | |
| Fiefia Sione | -- | -- |
Source: Public Records
Mortgage History
| Date | Status | Borrower | Loan Amount |
|---|---|---|---|
| Previous Owner | Fiefia Finau | $287,300 | |
| Previous Owner | Fiefia Sione | $92,250 | |
| Previous Owner | Fiefia Sione | $80,800 |
Source: Public Records
Tax History Compared to Growth
Tax History
| Year | Tax Paid | Tax Assessment Tax Assessment Total Assessment is a certain percentage of the fair market value that is determined by local assessors to be the total taxable value of land and additions on the property. | Land | Improvement |
|---|---|---|---|---|
| 2025 | $1,798 | $376,600 | $103,000 | $273,600 |
| 2024 | $1,798 | $343,100 | $97,500 | $245,600 |
| 2023 | $1,693 | $311,300 | $93,700 | $217,600 |
| 2022 | $1,831 | $315,900 | $91,900 | $224,000 |
| 2021 | $1,630 | $254,600 | $73,900 | $180,700 |
| 2020 | $1,595 | $237,200 | $66,000 | $171,200 |
| 2019 | $1,639 | $229,300 | $63,300 | $166,000 |
| 2018 | $1,330 | $181,200 | $63,300 | $117,900 |
| 2017 | $1,446 | $184,500 | $63,300 | $121,200 |
| 2016 | $1,370 | $166,400 | $60,900 | $105,500 |
| 2015 | $1,173 | $134,800 | $55,400 | $79,400 |
| 2014 | $1,126 | $128,300 | $54,200 | $74,100 |
Source: Public Records
Map
Nearby Homes
- 1978 Sir Robert Dr
- 1860 W 500 N Unit 20
- 1860 W 500 N Unit 7
- 555 N Starcrest Dr Unit B15
- 475 N Redwood Rd #58 Rd
- 475 N Redwood Rd Unit 49
- 825 Star Crest Dr W
- 548 N Redwood Rd
- 1711 W 400 N Unit 1719
- 558 N Redwood Rd Unit 1
- 558 N Redwood Rd Unit 3
- 768 N Redwood Rd Unit 19
- 768 N Redwood Rd Unit 1
- 949 Libby Way
- 261 N Redwood Rd
- 261 N Redwood Rd Unit 1
- 1827 Omni Ave
- 1004 N Sir Michael Dr
- 1989 Sir Timothy Ave
- 276 N Winter St
- 575 Sir Philip Dr
- 591 Sir Philip Dr
- 567 Sir Philip Dr
- 567 N Sir Philip Dr
- 599 N Sir Philip Dr
- 599 Sir Philip Dr
- 582 Sir Philip Dr
- 582 Sir Philip Dr W
- 590 Sir Philip Dr
- 559 Sir Philip Dr
- 574 Sir Philip Dr
- 607 Sir Philip Dr
- 598 Sir Philip Dr
- 598 N Sir Philip Dr
- 559 N Sir Philip Dr
- 566 N Sir Philip Dr
- 566 Sir Philip Dr
- 581 Sir Michael Dr
- 581 N Sir Michael Dr
- 589 Sir Michael Dr