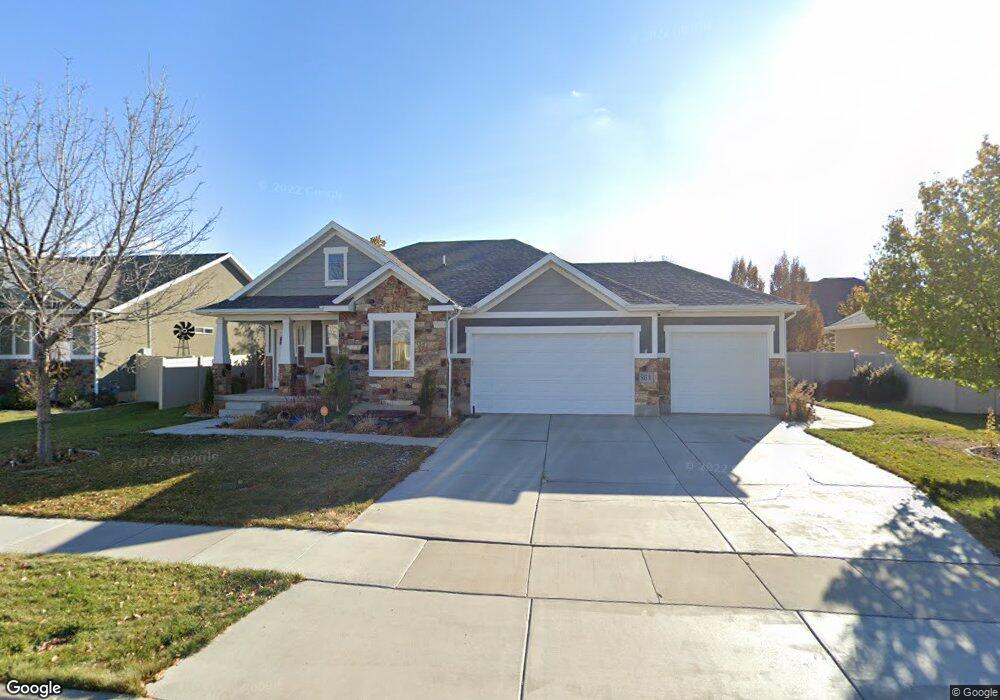
583 W 2010 S Syracuse, UT 84075
Estimated Value: $563,000 - $627,000
3
Beds
2
Baths
3,133
Sq Ft
$189/Sq Ft
Est. Value
About This Home
This home is located at 583 W 2010 S, Syracuse, UT 84075 and is currently estimated at $592,910, approximately $189 per square foot. 583 W 2010 S is a home located in Davis County with nearby schools including Bluff Ridge Elementary, Legacy Junior High School, and Clearfield High School.
Ownership History
Date
Name
Owned For
Owner Type
Purchase Details
Closed on
Feb 27, 2020
Sold by
Sparks Richard L and Sparks Sheryl L
Bought by
Sparks Richard Leroy and Sparks Sheryl Lynn
Current Estimated Value
Home Financials for this Owner
Home Financials are based on the most recent Mortgage that was taken out on this home.
Original Mortgage
$60,000
Outstanding Balance
$53,126
Interest Rate
3.6%
Mortgage Type
New Conventional
Estimated Equity
$539,784
Purchase Details
Closed on
Nov 2, 2013
Sold by
Perry Homes Utah Inc
Bought by
Shea Michael and Shea Susan J
Home Financials for this Owner
Home Financials are based on the most recent Mortgage that was taken out on this home.
Original Mortgage
$252,200
Interest Rate
4.18%
Mortgage Type
New Conventional
Create a Home Valuation Report for This Property
The Home Valuation Report is an in-depth analysis detailing your home's value as well as a comparison with similar homes in the area
Home Values in the Area
Average Home Value in this Area
Purchase History
| Date | Buyer | Sale Price | Title Company |
|---|---|---|---|
| Sparks Richard Leroy | -- | Inwest Title Services Inc | |
| Sparks Richard L | -- | North American Title | |
| Shea Michael | -- | Meridian Title Compa | |
| Perry Homes Utah Inc | -- | Meridian Title Compa |
Source: Public Records
Mortgage History
| Date | Status | Borrower | Loan Amount |
|---|---|---|---|
| Open | Sparks Richard Leroy | $60,000 | |
| Previous Owner | Shea Michael | $252,200 |
Source: Public Records
Tax History Compared to Growth
Tax History
| Year | Tax Paid | Tax Assessment Tax Assessment Total Assessment is a certain percentage of the fair market value that is determined by local assessors to be the total taxable value of land and additions on the property. | Land | Improvement |
|---|---|---|---|---|
| 2025 | $2,976 | $287,100 | $120,741 | $166,359 |
| 2024 | $2,831 | $275,000 | $95,989 | $179,011 |
| 2023 | $2,656 | $470,000 | $133,967 | $336,033 |
| 2022 | $2,982 | $289,300 | $77,641 | $211,659 |
| 2021 | $2,610 | $392,000 | $114,301 | $277,699 |
| 2020 | $2,366 | $344,000 | $101,503 | $242,497 |
| 2019 | $2,347 | $337,000 | $96,856 | $240,144 |
| 2018 | $2,176 | $310,000 | $94,802 | $215,198 |
| 2016 | $2,024 | $151,250 | $36,474 | $114,776 |
| 2015 | $1,869 | $132,990 | $36,474 | $96,516 |
| 2014 | $1,921 | $139,288 | $36,474 | $102,814 |
| 2013 | -- | $43,902 | $32,907 | $10,995 |
Source: Public Records
Map
Nearby Homes