Estimated Value: $92,000 - $154,000
4
Beds
1
Bath
2,496
Sq Ft
$46/Sq Ft
Est. Value
About This Home
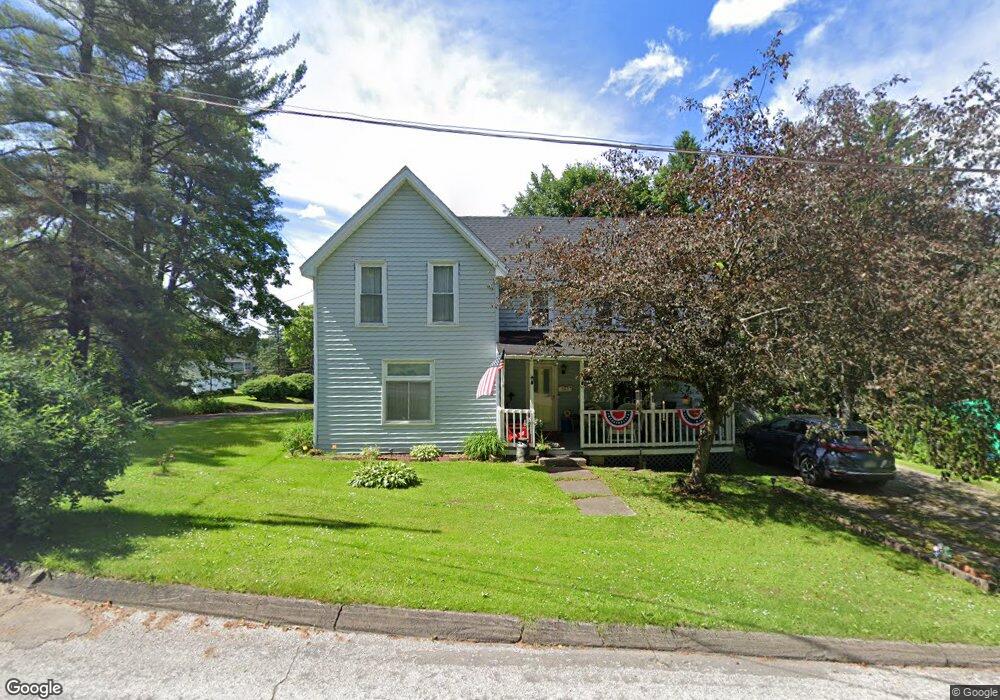
This home is located at 583 W Church St, Corry, PA 16407 and is currently estimated at $115,322, approximately $46 per square foot. 583 W Church St is a home located in Erie County with nearby schools including Corry Area Primary School, Corry Area Intermediate School, and Corry Area Middle School.
Ownership History
Date
Name
Owned For
Owner Type
Purchase Details
Closed on
Jun 15, 2022
Sold by
Sander Jr Stanley J
Bought by
Cooney Mark P and Cooney Kelli A
Current Estimated Value
Purchase Details
Closed on
Nov 10, 2011
Sold by
Miller Daniel G and Miller Tina
Bought by
Sander Stanley J and Sander Mark M
Home Financials for this Owner
Home Financials are based on the most recent Mortgage that was taken out on this home.
Original Mortgage
$54,000
Interest Rate
4.01%
Mortgage Type
Future Advance Clause Open End Mortgage
Purchase Details
Closed on
Aug 9, 2001
Sold by
Mellon Bank Na
Bought by
Carter Tina
Home Financials for this Owner
Home Financials are based on the most recent Mortgage that was taken out on this home.
Original Mortgage
$46,916
Interest Rate
11.37%
Purchase Details
Closed on
Jun 1, 2000
Sold by
Patten Robert E and Patten Barbara J
Bought by
Mellon Bank Na
Create a Home Valuation Report for This Property
The Home Valuation Report is an in-depth analysis detailing your home's value as well as a comparison with similar homes in the area
Home Values in the Area
Average Home Value in this Area
Purchase History
| Date | Buyer | Sale Price | Title Company |
|---|---|---|---|
| Cooney Mark P | $52,000 | None Listed On Document | |
| Sander Stanley J | $52,000 | None Available | |
| Carter Tina | $41,000 | -- | |
| Mellon Bank Na | $2,806 | -- |
Source: Public Records
Mortgage History
| Date | Status | Borrower | Loan Amount |
|---|---|---|---|
| Previous Owner | Sander Stanley J | $54,000 | |
| Previous Owner | Carter Tina | $46,916 |
Source: Public Records
Tax History Compared to Growth
Tax History
| Year | Tax Paid | Tax Assessment Tax Assessment Total Assessment is a certain percentage of the fair market value that is determined by local assessors to be the total taxable value of land and additions on the property. | Land | Improvement |
|---|---|---|---|---|
| 2025 | $1,757 | $53,720 | $5,700 | $48,020 |
| 2024 | $1,745 | $53,720 | $5,700 | $48,020 |
| 2023 | $1,702 | $53,720 | $5,700 | $48,020 |
| 2022 | $1,670 | $53,720 | $5,700 | $48,020 |
| 2021 | $1,658 | $53,720 | $5,700 | $48,020 |
| 2020 | $1,645 | $53,720 | $5,700 | $48,020 |
| 2019 | $1,619 | $53,720 | $5,700 | $48,020 |
| 2018 | $1,597 | $53,720 | $5,700 | $48,020 |
| 2017 | $1,570 | $53,720 | $5,700 | $48,020 |
| 2016 | $1,693 | $53,720 | $5,700 | $48,020 |
| 2015 | $1,679 | $53,720 | $5,700 | $48,020 |
| 2014 | $726 | $53,720 | $5,700 | $48,020 |
Source: Public Records
Map
Nearby Homes
- 571 W Church St
- 712 W Pleasant St
- 716 W Pleasant St
- 567 W Church St
- 704 W Pleasant St
- 306 Lemon St
- 0 W Pleasant St
- 568 W Church St
- 555 W Church St
- 604 W Church St
- 705 W Pleasant St
- 216 Northwest St
- 812 W Pleasant St
- 554 W Church St
- 807 W Pleasant St
- 619 W Church St
- 549 W Church St
- 608 W Church St
- 820 W Pleasant St
- 616 W Church St