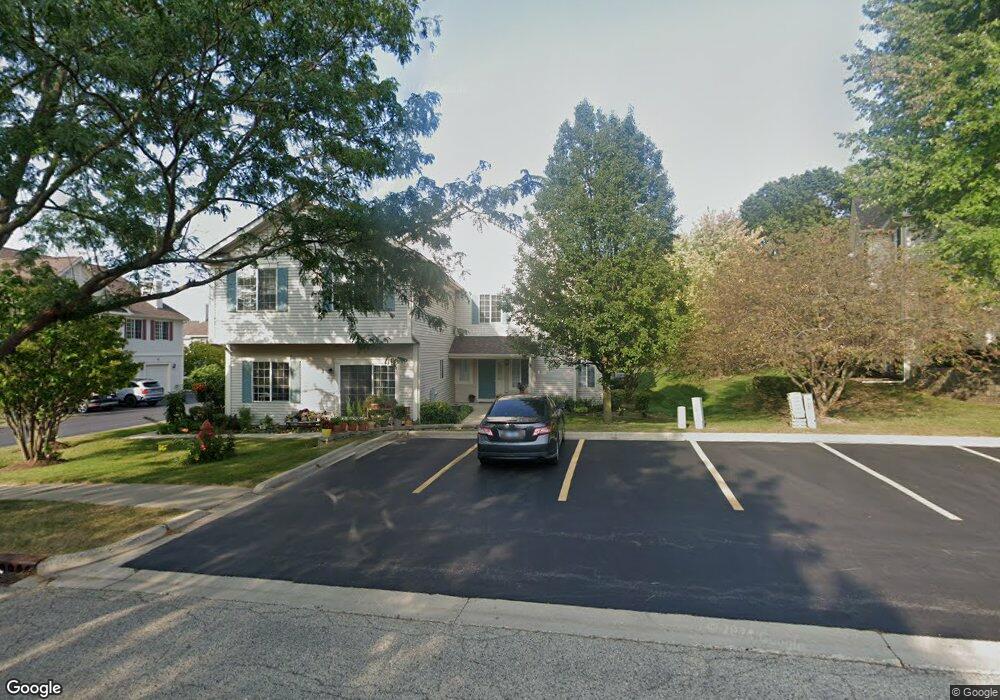
583 Windsor Dr Unit 11C Fox Lake, IL 60020
Estimated Value: $210,000 - $225,000
2
Beds
2
Baths
1,194
Sq Ft
$183/Sq Ft
Est. Value
About This Home
This home is located at 583 Windsor Dr Unit 11C, Fox Lake, IL 60020 and is currently estimated at $219,042, approximately $183 per square foot. 583 Windsor Dr Unit 11C is a home located in Lake County with nearby schools including Big Hollow Primary School, Big Hollow Elementary School, and Big Hollow Middle School.
Ownership History
Date
Name
Owned For
Owner Type
Purchase Details
Closed on
Aug 20, 2021
Sold by
Olandese Mark and Velez Leanne
Bought by
Galauskas Nicoel Denise and Howard James Henry
Current Estimated Value
Home Financials for this Owner
Home Financials are based on the most recent Mortgage that was taken out on this home.
Original Mortgage
$8,592
Outstanding Balance
$1,364
Interest Rate
2.7%
Mortgage Type
Stand Alone Second
Estimated Equity
$217,678
Purchase Details
Closed on
Aug 13, 2007
Sold by
Nigro Lon J and Nigro Jacklyn R
Bought by
Olandese Mark and Velez Leanne
Home Financials for this Owner
Home Financials are based on the most recent Mortgage that was taken out on this home.
Original Mortgage
$161,689
Interest Rate
6.69%
Mortgage Type
FHA
Purchase Details
Closed on
Jul 10, 2002
Sold by
Harris Trust & Svgs Bank
Bought by
Nigro Jacklyn R and Nigro Lon J
Home Financials for this Owner
Home Financials are based on the most recent Mortgage that was taken out on this home.
Original Mortgage
$20,000
Interest Rate
6.32%
Create a Home Valuation Report for This Property
The Home Valuation Report is an in-depth analysis detailing your home's value as well as a comparison with similar homes in the area
Home Values in the Area
Average Home Value in this Area
Purchase History
| Date | Buyer | Sale Price | Title Company |
|---|---|---|---|
| Galauskas Nicoel Denise | $175,000 | Chicago Title | |
| Olandese Mark | $164,000 | Ticor Title Insurance Co | |
| Nigro Jacklyn R | $146,000 | Chicago Title |
Source: Public Records
Mortgage History
| Date | Status | Borrower | Loan Amount |
|---|---|---|---|
| Open | Galauskas Nicoel Denise | $8,592 | |
| Open | Galauskas Nicoel Denise | $171,830 | |
| Previous Owner | Olandese Mark | $161,689 | |
| Previous Owner | Nigro Jacklyn R | $20,000 |
Source: Public Records
Tax History
| Year | Tax Paid | Tax Assessment Tax Assessment Total Assessment is a certain percentage of the fair market value that is determined by local assessors to be the total taxable value of land and additions on the property. | Land | Improvement |
|---|---|---|---|---|
| 2024 | $3,907 | $59,587 | $7,752 | $51,835 |
| 2023 | $4,053 | $56,135 | $7,303 | $48,832 |
| 2022 | $4,053 | $49,711 | $4,691 | $45,020 |
| 2021 | $3,523 | $42,393 | $4,422 | $37,971 |
| 2020 | $3,674 | $43,510 | $4,359 | $39,151 |
| 2019 | $3,531 | $41,724 | $4,180 | $37,544 |
| 2018 | $2,537 | $32,143 | $4,309 | $27,834 |
| 2017 | $2,458 | $29,710 | $3,983 | $25,727 |
| 2016 | $2,434 | $27,172 | $3,643 | $23,529 |
| 2015 | $2,273 | $25,357 | $3,400 | $21,957 |
| 2014 | $1,845 | $21,589 | $3,246 | $18,343 |
| 2012 | $2,076 | $22,497 | $3,383 | $19,114 |
Source: Public Records
Map
Nearby Homes
- 530 Foxridge Dr Unit 20C
- 35403 N 2nd Ave
- 35828 N Marine Dr
- 994 Reserve Ct
- 411 Kings Rd
- 34 Elm Ave
- 11 Highview Ave
- 10 S Maple Ave
- 11 S Lake Ave
- 176 E Grand Ave
- 235 E Grand Ave
- 21 Hillside Dr
- 35769 N Cedar Island
- 127 E Grand Ave
- 314 Mastodon Dr
- 8 Cross St
- 605 Rollins Rd
- 69 Washington St
- 35 Medinah Ave
- 35 Tremont Rd
- 583 Windsor Dr Unit C
- 579 Windsor Dr Unit 11A
- 581 Windsor Dr Unit 11B
- 581 Windsor Dr Unit 581
- 593 Windsor Dr Unit 1D
- 593 Windsor Dr
- 591 Windsor Dr Unit 10C
- 589 Windsor Dr Unit 10B
- 587 Windsor Dr Unit A10
- 589 Windsor Dr Unit B
- 585 Windsor Dr Unit 11D
- 577 Windsor Dr Unit 12D
- 573 Windsor Dr Unit 12B
- 575 Windsor Dr Unit 12C
- 571 Windsor Dr Unit 12A
- 571 Windsor Dr Unit A
- 537 Foxridge Dr Unit 13B
- 539 Foxridge Dr Unit 13C
- 533 Foxridge Dr Unit 14D
- 535 Foxridge Dr Unit 13A
Your Personal Tour Guide
Ask me questions while you tour the home.